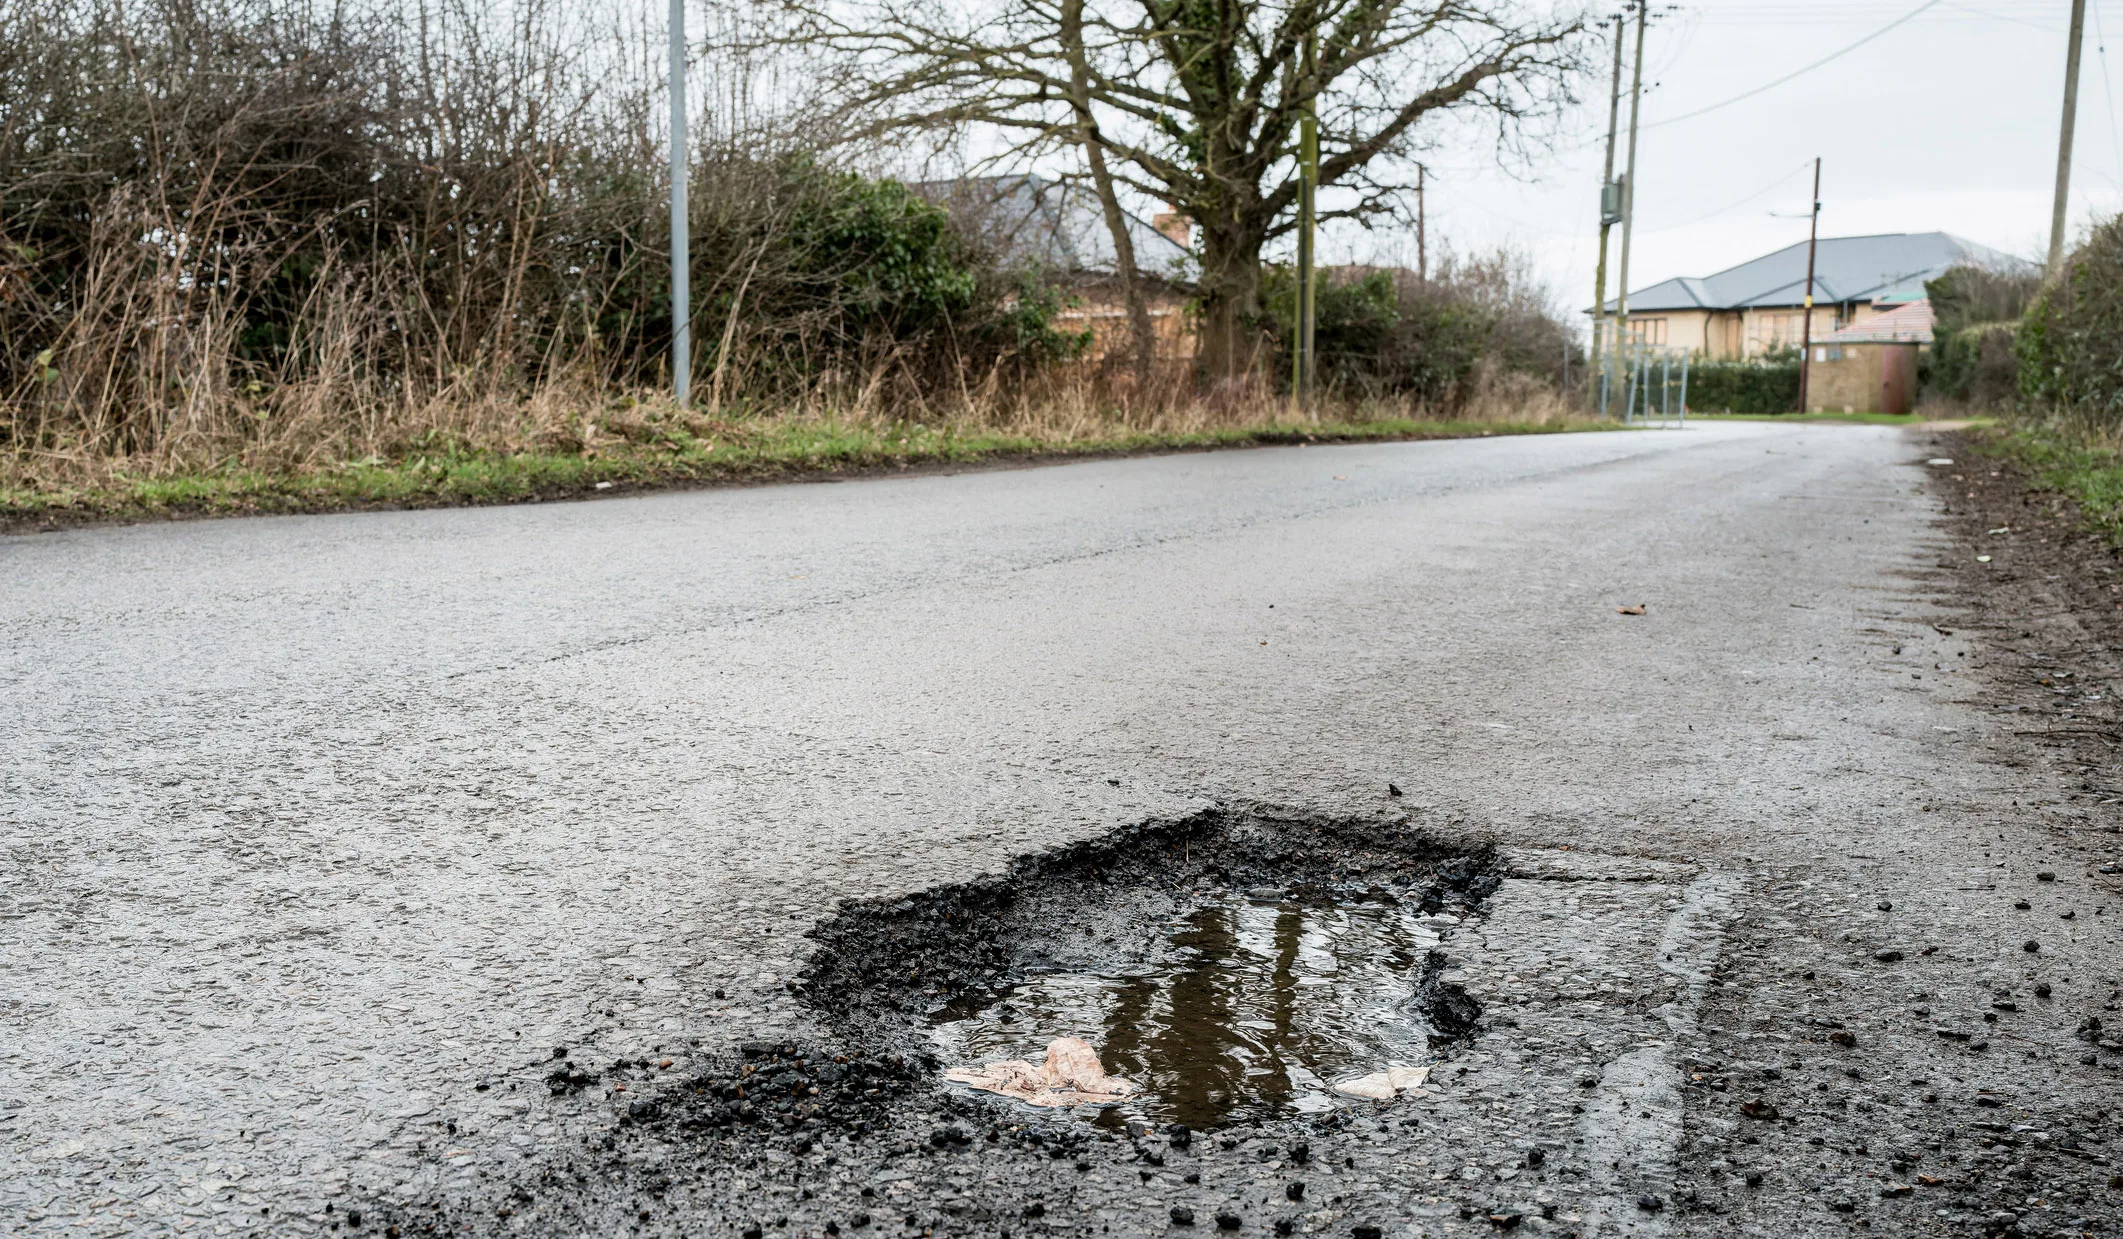
Every spring the asphalt industry publishes an estimate of how many potholes councils filled and what it would cost to catch up. Every January the Department for Transport publishes the condition of local roads, a year in arrears. Since January 2026 it has also graded all 154 local highway authorities red, amber or green, and since June 2025 every council has had to publish a 'transparency report' saying how many potholes it filled and what it spent. The RAC and the AA count the breakdowns, and the RAC has used freedom of information requests to count the compensation claims. Nobody joins these up. This piece does: a decade of the industry survey, the official condition tables for every authority back to 2010, the ratings, the funding allocations and road lengths of all 154 authorities, 51 of the councils' own reports read page by page, the breakdown and claims figures, and the law that decides who pays. The method, the full tables and the caveats are in the attached appendix.3457925
5,200 potholes filled every day, and the bill still hit a record £18.6 billion
The only long-run count of potholes filled comes from the Asphalt Industry Alliance's ALARM survey, a confidential questionnaire to council highway departments answered this year by 79% of authorities in England and Wales and grossed up to a national estimate. It is an industry survey, run by the people who sell the asphalt, and its answers are self-reported; but the Department for Transport itself quotes its cost-per-pothole figure in parliamentary answers, and no official count exists. Its estimate for 2025/26 is 1,903,498 potholes filled, 'the same as reported in ALARM 2025', more than 5,200 a day, at a cost of £149.3 million. Over a decade the figure has swung between 1.4 million and 2.2 million; the last three years, 1.99 million, 1.90 million and 1.90 million, are the highest since 2015/16. Filling more holes has not reduced the bill. The 'one-time catch-up cost', what it would take to bring the network to a reasonable state in one go, was £9.79 billion in 2019 and is £18.62 billion this year, £16.78 billion of it in England outside London and £1.22 billion in London. ALARM puts the share of local roads in good structural condition at 51%, says 16% of the network, about 32,500 miles, has under five years of structural life left, and reports that the average road is now resurfaced once every 97 years, 106 in England outside London and 39 in London. A planned repair cost £63.11 on average, a reactive one £93.79, and in London a reactive repair £112.29. The alliance's chair called the state of local roads 'a national disgrace'.12321
ALARM survey (financial year) | Potholes filled, England and Wales | One-time catch-up cost | Years between resurfacing, England outside London | Compensation paid to road users | Response rate |
|---|---|---|---|---|---|
2019 (2018/19) | 1,860,072 | £9.79bn | 79 | £6.9m | 64% |
2020 (2019/20) | 1,481,746 | £11.14bn | 76 | £8.1m | 67% |
2021 (2020/21) | 1,674,236 | £10.24bn | 83 | £3.6m | 63% |
2022 (2021/22) | 1,701,918 | £12.64bn | 84 | £8.9m | 73% |
2023 (2022/23) | 1,407,432 | £14.02bn | 143 | £11.6m | 75% |
2024 (2023/24) | 1,985,480 | £16.30bn | 86 | £15.2m | 72% |
2025 (2024/25) | 1,898,650 | £16.81bn | 103 | £19.7m | 78% |
2026 (2025/26) | 1,903,498 | £18.62bn | 106 | £15.9m | 79% |
Official statistics: main roads at their worst since 2013, and less road repaired than a decade ago
The Department for Transport's own measure is the share of road length where 'maintenance should have been considered', the red band of a survey that councils run with laser-fitted vehicles or by eye and send in each year. Its latest release, published in January 2026 and covering the year to March 2025, puts that share at 5% of local A roads, 7% of B and C roads and 17% of unclassified roads in England. The A-road figure sat at 3% from 2016 to 2019; it is now back at its 2013 level, and the share of A roads rated green has fallen from 74% in 2018 to 67%, dropping in every year since 2019. The East Midlands is the worst region on A roads at 9%, up from 2% in 2017, and London next at 8%. The amount of road being treated has also fallen: 7.5% of local A roads received some maintenance treatment in 2015, 4.7% in 2024, the lowest in the series, and 5.8% in 2025; for minor roads the figure is 2.9%. Councils spent £5.0 billion on road maintenance in 2024/25 at today's prices, 9% less than the £5.5 billion of 2009/10. The National Audit Office, reviewing the system in July 2024, found that the department 'does not have a good enough understanding of the condition of local roads', had evaluated one of the twelve funding pots it had created, and 'does not know whether the funds it allocates are delivering improvements in road condition'. The department's own 2019 estimate of the backlog was £7.6 billion to £11.7 billion. The next official release, for the year to March 2026, is due this autumn and had not appeared when this was written.422
Pothole breakdowns up 15% in a year, and tripled in one wet February
The motoring organisations measure the damage. The RAC's patrols attended 26,048 breakdowns in 2025 where a damaged shock absorber, a broken spring or a distorted wheel was the cause, up 3,345 on 2024 and 71 a day; its long-run average is 25,309. In the three months to September 2025 the figure was up a quarter on the year before. Then came the wet winter: in February 2026 RAC members mentioned potholes 6,290 times when they called for help, 225 a day against 66 a day in February 2025, after what the RAC called one of the worst Februarys for rain in 126 years. The AA attended 643,318 pothole-related incidents in 2024, more than 1,700 a day, and 613,638 in 2025; it puts the average repair at £350 and the national bill to drivers at £645 million a year, while the RAC puts a repair worse than a puncture at up to £590. In the RAC's survey of drivers this September, 51% named the state of local roads as their biggest motoring worry, up from 47%, 66% said the roads near them had got worse, and 34% had suffered damage from a poor surface in the past year, up from 29%. The cheapest fix is the one done before the hole appears. Surface dressing, which seals a road for ten to fifteen years, covered 44.4 million square metres in 2025, up 15% on 2024 and 25% on 2023, the lowest year since records began in 1978, and still 32% below 2012. The department's April 2026 letter to councils records that 'thirty-eight authorities reported that they had not carried out preventative carriageway maintenance in 2025 to 2026' and requires their staff to be trained in it.23242829272610
Derbyshire: 43% of its B roads failing, the worst in England, and 13 councils rated red
In January 2026 the department graded every local highway authority for the first time, on three scorecards: road condition, whether it spends at least what it is given, and 'wider best practice' drawn from the transparency reports. Sixteen came out green, 125 amber and 13 red: Bedford, Bolton, Cumberland, Derbyshire, Greenwich, Kensington and Chelsea, Leicestershire, North Lincolnshire, Slough, Suffolk, Waltham Forest, West Northamptonshire, and Westmorland and Furness. Only Portsmouth, Rotherham and West Berkshire were green on all three. A red spend score means the council told the department its capital investment in roads was less than the department's grant. The ratings are a composite, and a council that reported poorly is rated on what it reported; several London boroughs carry the department's note that their condition grade rests on incomplete data. Ministers have used the table politically from the day it appeared. 'Of the 13 local authorities that were rated red last month for their action on fixing local roads, three were Reform-led councils,' the Transport Secretary told the Commons in February. 'By contrast, Labour councils came out top.' Her roads minister repeated in March that Reform 'came out by far the worst'. Ten of the 13, including Greenwich, Slough, Suffolk and Bolton, were not Reform-run.563435
The condition tables themselves give a plainer league table. Taking the department's red share for each of the three road classes and averaging them, for the 123 authorities with complete data, Derbyshire is worst by a distance: 29% of its A roads, 43% of its B and C roads and 36% of its unclassified roads should have had maintenance considered in the year to March 2025, an average of 36%, against 13% in 2019. Derbyshire's own technical annex says its figures come from an engineers' inspection with council-defined bands and are 'not comparable' with the laser surveys most councils use, and on the new national standard it reports under 1% of roads in the worst band; but the department rated it red on condition and the RAC's claims data, with 3,307 claims in 2024 against 224 in 2021, points the same way. The City of London is second at 32%, on a 29-mile network where a few bad streets move the figure. Then Nottingham at 18%, Liverpool at 16.3%, up from 4.7% in 2019, Leeds and Calderdale and Salford at 16%, and Bath and North East Somerset, Southend, Waltham Forest, Kent and Cambridgeshire between 15% and 15.3%. Leeds is rated green overall. The worst unclassified roads, the residential streets most people live on, are in Derbyshire at 36%, Kent, Salford and Plymouth at 35% and Bolton at 34%. The best-kept networks are the Isle of Wight at 1.7%, Portsmouth at 2.0% and West Berkshire at 3.3%. The sharpest deteriorations since 2019 are Liverpool, Salford, Slough from 4.3% to 13.3% and Milton Keynes from 2.0% to 10.7%; the sharpest improvements are Lewisham, from 24% to 7%, and York, from 20.3% to 10.7%.43725
London's A roads are the worst in any region, 32 of 33 boroughs got worse, and the boroughs got a quarter of the money per mile
London's A roads are in a worse state than any other region's: 8% should have had maintenance considered in the year to March 2025, with 60% rated green against 67% nationally. Thirty-two of the 33 boroughs have a higher red share on their A roads than in 2019; only the City of London is unchanged. Brent is worst at 14%, Ealing and Newham at 12%, Barking and Dagenham and Hackney at 11%, Barnet, Camden, Islington and Redbridge at 10%; Redbridge was at 2% in 2019, Havering at 1% and is now 6%. For the smaller roads the picture is missing: 16 boroughs have no usable figure for their B and C or unclassified roads, which is why so many borough condition grades carry the department's incomplete-data note, and why London's minor-road data is the weakest in England. Three boroughs are red overall. Greenwich is red on spending and on best practice; Kensington and Chelsea is red on condition; Waltham Forest is red on condition and on best practice. Bromley, Kingston, Merton, Richmond, Sutton and Wandsworth are red on condition but amber overall. Hillingdon and Lewisham are green. Transport for London, which runs the red routes, is amber, with 1.8% of its A roads red and the only actual repair time any authority publishes: 1.7 days from report to fix.4543
The money followed a different map. Until this year London boroughs received no share of the Highways Maintenance Block that funds every other council, because London's roads were deemed to be funded through Transport for London; in 2025/26 they got only the 'new funding' element, £23.3 million between them for 9,185 miles of road, between £1,900 and £2,700 a mile, against £14,055 a mile for Brighton and Hove, £12,901 for Milton Keynes and £12,423 for Cheshire East. From April 2026 the boroughs are 'eligible for baseline funding for the first time' and their allocation rises to £57.7 million, two and a half times as much, with Tower Hamlets at £9,708 a mile and the City of London at £9,552, though Hounslow, whose roads are maintained under a private finance contract, stays at £2,866. The comparison is not like for like, since it leaves out what Transport for London and the boroughs spend themselves, and the industry survey's London sample suggests the capital's roads are in better structural shape than the shires': 82,336 potholes filled in 2025/26, a £1.22 billion backlog, resurfacing every 39 years against 106 outside London, and 80 compensation claims per borough with £3.0 million paid in total.7892
Borough | DfT rating, overall / condition | A roads red, 2019 to 2025 | DfT capital 2025/26, £ per mile | DfT capital 2026/27, £ per mile | Potholes filled, council's own report |
|---|---|---|---|---|---|
Greenwich | Red / Amber | 4% to 8% | 2,530 | 7,099 | report not retrievable |
Kensington and Chelsea | Red / Red | 3% to 4% | 2,498 | 5,894 | report not retrievable |
Waltham Forest | Red / Red | 2% to 7% | 2,625 | 7,618 | report not retrievable |
Brent | Amber / Amber | 6% to 14% | 2,632 | 5,827 | 8,383 (2025/26) |
Ealing | Amber / Amber | 4% to 12% | 2,566 | 4,428 | 3,027 (2024/25) |
Newham | Amber / Amber | 5% to 12% | 2,589 | 5,601 | 1,578 (2024/25) |
Redbridge | Amber / Amber | 2% to 10% | 2,582 | 5,471 | 2,467 or 11,789 (2025/26) |
Croydon | Amber / Amber | 8% to 9% | 2,578 | 5,616 | 2,706 (2025/26) |
Havering | Amber / Amber | 1% to 6% | 1,941 | 7,321 | 2,238 (2025/26) |
Camden | Amber / Amber | 7% to 10% | 2,592 | 5,494 | 280 (2025/26) |
Tower Hamlets | Amber / Amber | 4% to 8% | 2,426 | 9,708 | 307 (2024/25) |
Hillingdon | Green / Green | 2% to 4% | 2,587 | 7,191 | 987 (2025/26) |
Lewisham | Green / Green | 4% to 7% | 2,544 | 6,063 | 3,075 (2025/26) |
Hounslow | Amber / Green | 1% to 3% | 2,488 | 2,866 | 1,035 (2024/25) |
Nottinghamshire says 71,141, Camden says 280: the councils' own pothole counts cannot be added up
Since March 2025 every council has had to publish, on pain of losing a quarter of its funding uplift, how many potholes it filled in each of the last five years. We tried to read all 154 reports from the links on the department's ratings page. Fifty-one could be read in full: 23 London boroughs plus Transport for London, and 28 of the largest counties, unitaries and cities. The rest sat behind council websites that refuse automated readers, broken links or pages that had been replaced; the appendix lists which. What the 51 show is that the counts cannot be added up. Nottinghamshire reports 'approximately 71,141' potholes repaired in 2025/26, Derbyshire 66,784, Lincolnshire about 64,140, Devon about 58,000, Gloucestershire 51,539 including 7,838 on pavements, Cambridgeshire 47,365, Surrey around 45,000 'on our roads and pavements', Cornwall 44,186, Northumberland 41,592. North Yorkshire reports 10,513, but that is work orders, 'each work order contains multiple pothole' repairs. Hertfordshire reports 24,842 'pothole units', one unit being a square metre. Westmorland and Furness went from 16,107 to 34,228 in a year because it changed from counting defects to counting repairs. Redbridge gives 2,467 on the department's template and 11,789 in its own annual pothole table. Islington gives 4,575, all temporary, in its transparency report and 1,638 in its own monthly pothole report for most of the same period. Lewisham counts only temporary repairs and says its figure is 'likely to underestimate'; Bexley converts the area patched into 'pothole equivalents'; Camden's 280 sits beside 'over 7,300 defects' addressed. The department's own guidance for this year's reports concedes that 'different authorities will estimate the number of potholes they have filled differently'. Adding up the London reports that give a 2025/26 figure, 16 boroughs and Transport for London, produces 51,213 potholes, against the industry survey's grossed-up London estimate of 82,336.5363746503847444842454941122
Authority | 2023/24 | 2024/25 | 2025/26 | What is counted |
|---|---|---|---|---|
Nottinghamshire | not given | not given | c.71,141 | potholes repaired, approximate |
Derbyshire | not given | not given | 66,784 | potholes, 40mm investigatory depth |
Lincolnshire | not given | not given | c.64,140 | potholes repaired, approximate |
Devon | not given | not given | c.58,000 | potholes meeting safety criteria |
Gloucestershire | 48,148 | 47,981 | 51,539 | carriageway and footway potholes |
Cambridgeshire | 65,219 | 52,229 | 47,365 | potholes repaired |
Cornwall | 34,468 | 36,501 | 44,186 | potholes filled |
Northumberland | not given | not given | 41,592 | potholes repaired |
Staffordshire | 32,437 | 37,308 | not given | potholes filled |
West Sussex | 48,104 | 44,699 | 32,280 | earlier years include preventative-programme potholes |
Westmorland and Furness | 16,107 | 34,228 | not given | method changed mid-2023/24 from defects to repairs |
Hertfordshire | not given | not given | 24,842 | 'pothole units', one square metre each |
Essex | 13,221 | 18,636 | not given | pothole defects on the asset system |
Leeds | 14,646 | 26,007 | not given | potholes filled |
Bradford | 13,289 | 11,761 | 8,986 | temporary repairs only |
North Yorkshire | 11,878 | 11,015 | 10,513 | work orders, each with several potholes |
Liverpool | not given | not given | 10,501 | potholes filled |
Brent | not given | not given | 8,383 | includes 5,558 by injection patcher |
Camden | 294 | 340 | 280 | potholes; 'over 7,300 defects' also addressed |
Where a council has reported two or three years on the same basis, the direction is mixed: up at Cornwall, Staffordshire and Essex, down at Cambridgeshire, West Sussex, Bradford and most London boroughs with two years of data. The reports are more revealing on what the problem would cost. Cambridgeshire puts its backlog at £800 million. Nottinghamshire says that even after a record 2026/27 budget of £118 million its backlog will fall only to about £317 million, and that holding the network steady needs £101 million a year. Leeds puts its backlog at £288.3 million, Croydon at £147 million for carriageways and £114 million for pavements, Havering at £50 million to £70 million. The unit cost of a permanent reactive repair ranges from £50.57 in Lincolnshire and £65.27 in Brent to £158 in Nottinghamshire and £203 in Hertfordshire. And every one of the 51 reports is silent on one thing the public asks about most: not one gives the number of compensation claims it received, paid or refused, because the department's template does not ask.383639404644
Claims up 91% in three years, three in four refused, and the law says that is fine
The RAC's freedom of information requests to 207 councils in England, Scotland and Wales, answered by 177, found 53,015 pothole compensation claims in 2024 against 27,731 in 2021, a rise of 91%, after a peak of 56,655 in 2023. The 173 councils that gave payment figures settled 13,832 of them, 26%, at an average of £390, about £3.56 million in all; 45% of councils refused more than nine in ten claims, and Gloucestershire, Worcestershire, Medway and Telford refused 99%. Derbyshire received 3,307 claims and paid 2,355 of them, the most money of any council; Merton paid the highest average, £2,267, on five claims; Staffordshire, Derbyshire, Edinburgh and Bury received a claim for every mile of road they maintain. The industry survey's figures, which cover England and Wales and include the cost of handling, show claims falling from a record average of 410 per authority in 2024/25 to 279 in 2025/26, 99% of them about potholes, with £15.9 million paid out and £15.1 million spent on staff to deal with them. The reason three in four claims fail is in the Highways Act 1980. Section 41 places on every highway authority an absolute 'duty to maintain the highway'. Section 58 gives it a defence: it is enough 'to prove that the authority had taken such care as in all the circumstances was reasonably required to secure that the part of the highway to which the action relates was not dangerous for traffic', and the court must consider, among other things, 'whether the highway authority knew, or could reasonably have been expected to know' that the road was dangerous. In practice the council produces its inspection records, and if the hole appeared after the last inspection and nobody reported it, the claim fails. The Court of Appeal restated the test in June 2025 in Karpasitis v Hertfordshire, a cyclist injured by a hole in a verge in 2020. The trial judge had accepted the inspector's word that he had walked the road; the Court of Appeal said that 'overlooks a basic principle of fact-finding. The usual approach is to start by looking at contemporaneous documents', in that case the vehicle-tracking data that showed he had not, and found for the cyclist with a third knocked off for his own carelessness.252303132
What counts as dangerous is for each council to decide. 'Individual authorities set their own criteria, including the minimum size and depth at which a defect, or pothole, is recorded or repaired,' the roads minister told the Commons in March; the thresholds 'vary between areas and are not prescribed by the Department for Transport'. Devon will treat a hole as a safety defect at 40 millimetres deep and 300 across; Surrey at 40 deep and 150 across; Cambridgeshire gives itself two hours for anything over 75 millimetres and thirteen weeks for 25 to 39; Camden intervenes at 30. A driver whose wheel is broken by a 35-millimetre hole in one county would have had a claim across the border. The department, asked how many claims there are, says it 'does not hold information on the number of pothole damage claims'; asked whether councils should pay, the Lords minister says claims are 'entirely the responsibility of the relevant highway authority' and 'it is for the court to determine'. That is the whole of national policy on compensation.205038411918
'Seven million more potholes' was £500 million divided by £70: the pledge nobody can check, and the third held back
The money has risen, and the arguments about it have not changed. In November 2023 the Conservative government promised £8.3 billion over eleven years from the cancelled northern leg of HS2, 'enough to resurface over 5,000 miles of road'; only £300 million of it had been allocated when the government changed, and the Transport Secretary told the Commons in January 2025 that the rest belonged 'in exactly the same category as the promise to provide 40 new hospitals. They were fantasy figures'. Her own government put £1,567 million into local road maintenance in England in 2025/26, a £500 million uplift on the year before, and said the uplift was 'enough to fix the equivalent of over 7 million extra potholes'. A written answer in January 2026 explains the arithmetic: the department divided £500 million by 'the industry assumption that the national average cost of repairing a pothole is approximately £70'. The industry's own survey says the number of potholes filled did not rise at all. A quarter of the uplift, £125 million, was held back until councils published their transparency reports, and was paid out in January 2026 with the non-compliant authorities' share redistributed; the department has not named them. The Spending Review then set £7.3 billion for 2026/27 to 2029/30, rising from £1,617 million next year to £2,134 million in 2029/30, and from this April up to a third of each year's money, £525 million, is withheld until a council publishes its report, shows it is spending at least 99% of its grant on roads, updates its asset strategy and trains its staff. The department's answer to the question of whether the money is for potholes is that it is not: 'Local highway authorities can choose to spend Highways Maintenance Block funding on all parts of their highway network. Funding is not specifically for potholes.' Asked what baseline the manifesto pledge of 'an additional 1 million potholes across England each year' is measured against, and how many have been filled above it, the minister replied that the figures are 'published in authorities' highways maintenance transparency reports', which, as above, cannot be added up. Sir Desmond Swayne, who declared an interest 'having lost three tyres to potholes this year', asked the question drivers ask: 'What on earth is it filling them with, because within weeks and sometimes days, a newly filled pothole is back again?'331314152781011171635
Year | DfT capital for local road maintenance, England | Held back as incentive | Condition for release |
|---|---|---|---|
2025/26 | £1,567m (baseline £1,067m plus £500m uplift) | £125m | transparency report by 30 June 2025 and technical annex by 31 October 2025 |
2026/27 | £1,617m | £525m | report by 10 September 2026 (50%), spend 99% of grant on roads (25%), asset strategy (12.5%), staff training (12.5%) |
2027/28 | £1,726m | £525m | annual report and ratings |
2028/29 | £1,867m | £530m | annual report and ratings |
2029/30 | £2,134m | £540m | annual report and ratings |
What this can and cannot tell you
It can tell you what the industry survey has estimated every year for a decade, what the department's condition tables show for every authority back to 2010, how every council was rated in January 2026, what each was allocated per mile of road, what 51 councils said in their own reports and what the RAC found when it asked about claims. It cannot tell you how many potholes there are. The ALARM survey is a confidential questionnaire with a 56% to 79% response rate, grossed up by a trade body whose members sell asphalt, and its London figures rest on a handful of boroughs; it is used here because the Department for Transport uses it too and has nothing of its own. The condition statistics measure the share of road length where maintenance should be considered, from surveys whose methods changed for some councils from 2024 and which many councils do not run on minor roads every year; 30 authorities have at least one class missing for 2025, and the figures for Derbyshire and the City of London come with their own health warnings, set out above. The ratings are the department's composite and rest in part on what councils reported about themselves. The councils' pothole counts are not comparable and are presented as each council printed them. The RAC's claims figures cover the councils that answered, in three nations. Funding per mile is the department's capital grant only, and excludes what councils and Transport for London spend from their own budgets, which is why the London comparison is flagged as not like for like. The next official condition release, for the year to March 2026, was due this autumn and had not been published; the second round of council reports was due on 10 September 2026 and the second round of ratings had not appeared. Councils named here are named for their published figures and ratings, not for the quality of their work, and any council that believes a figure misrepresents it is welcome to say so.34525



Comments
Sign in to join the conversation.