Every council that enforces parking is supposed to publish an annual report on how many tickets it issues, how many are cancelled and what it does with the money. Most do not make the figures easy to find, and no government department collects them. So this piece assembles them from the places they do exist: London Councils' annual statistics for every borough and TfL since 2018-19; the London Tribunals' appeal statistics for every borough over the same years; the revenue outturn returns every English council files with the Ministry of Housing, Communities and Local Government, which carry each council's parking income, spending and a separate line for ticket income; the Traffic Penalty Tribunal's reports for England outside London; and the figures councils outside London report to PATROL, the joint committee that funds that tribunal. The result is a league table for London on four measures and for England on money, with the data pack attached. Outside London, per-council ticket counts exist only inside an interactive dashboard that cannot be downloaded, so for those councils the money is the measure.1357841
Nine and a half million
In 2019-20, the last full year before the pandemic, London's 33 boroughs and TfL issued 6,182,439 penalty charge notices. In 2024-25 they issued 9,457,848, a rise of 53%, and 13.5% more than the year before. Parking tickets, the ones left on windscreens or issued by camera in car parks and on yellow lines, rose by 31% to 5.17 million. Bus lane tickets were flat at 373,070. The growth is almost all in the third category, moving-traffic contraventions enforced by camera: entering a yellow box, making a banned turn, driving through a school street or a low-traffic neighbourhood filter. Those went from 1,829,348 to 3,913,503, more than double, and from 30% of all tickets to 41%. London Councils says 99.55% of the capital's two billion car journeys a year end without a ticket; the other 0.45% is nine and a half million.1217
Westminster is the largest issuer by a distance, 580,187 tickets, almost all of them parking, in a borough of 212,367 residents and several million daily visitors. Then Islington with 450,653, Newham 438,834, Hammersmith and Fulham 435,243, Haringey 404,891 and Lambeth 404,399. Divided by residents the order changes. The City of London, a square mile with 15,631 people living in it, issues 6,660 tickets per 1,000 of them, a figure that says more about commuters than residents. Westminster issues 2,732 per 1,000, Hammersmith and Fulham 2,288, Islington 2,007, Kensington and Chelsea 1,903, Camden 1,607. At the other end, Sutton issues 304, Bromley 320, Hillingdon 336 and Bexley 375: outer boroughs with driveways and few cameras. The growth table is a different list again. Southwark's tickets have risen 185% since 2019-20, from 120,849 to 344,701; Greenwich's 185%; Lewisham's 147%; Redbridge's 123%; Barking and Dagenham's 113%; Hackney's 103%. In the City the number fell by a third, and in Kingston it fell slightly.16
Borough, 2024-25 | All PCNs | Per 1,000 residents | Moving traffic PCNs | Change since 2019-20 |
|---|---|---|---|---|
Westminster | 580,187 | 2,732 | 63,625 | +83% |
Islington | 450,653 | 2,007 | 197,630 | +50% |
Newham | 438,834 | 1,165 | 162,937 | +49% |
Hammersmith and Fulham | 435,243 | 2,288 | 271,265 | +83% |
Haringey | 404,891 | 1,521 | 202,535 | +70% |
Lambeth | 404,399 | 1,287 | 193,156 | +65% |
Camden | 348,216 | 1,607 | 125,852 | +37% |
Southwark | 344,701 | 1,104 | 138,431 | +185% |
Redbridge | 332,661 | 1,034 | 163,317 | +123% |
Croydon | 323,405 | 789 | 205,994 | +82% |
Transport for London | 852,842 | n/a | 354,256 | +14% |
All boroughs and TfL | 9,457,848 | n/a | 3,913,503 | +53% |
The cameras
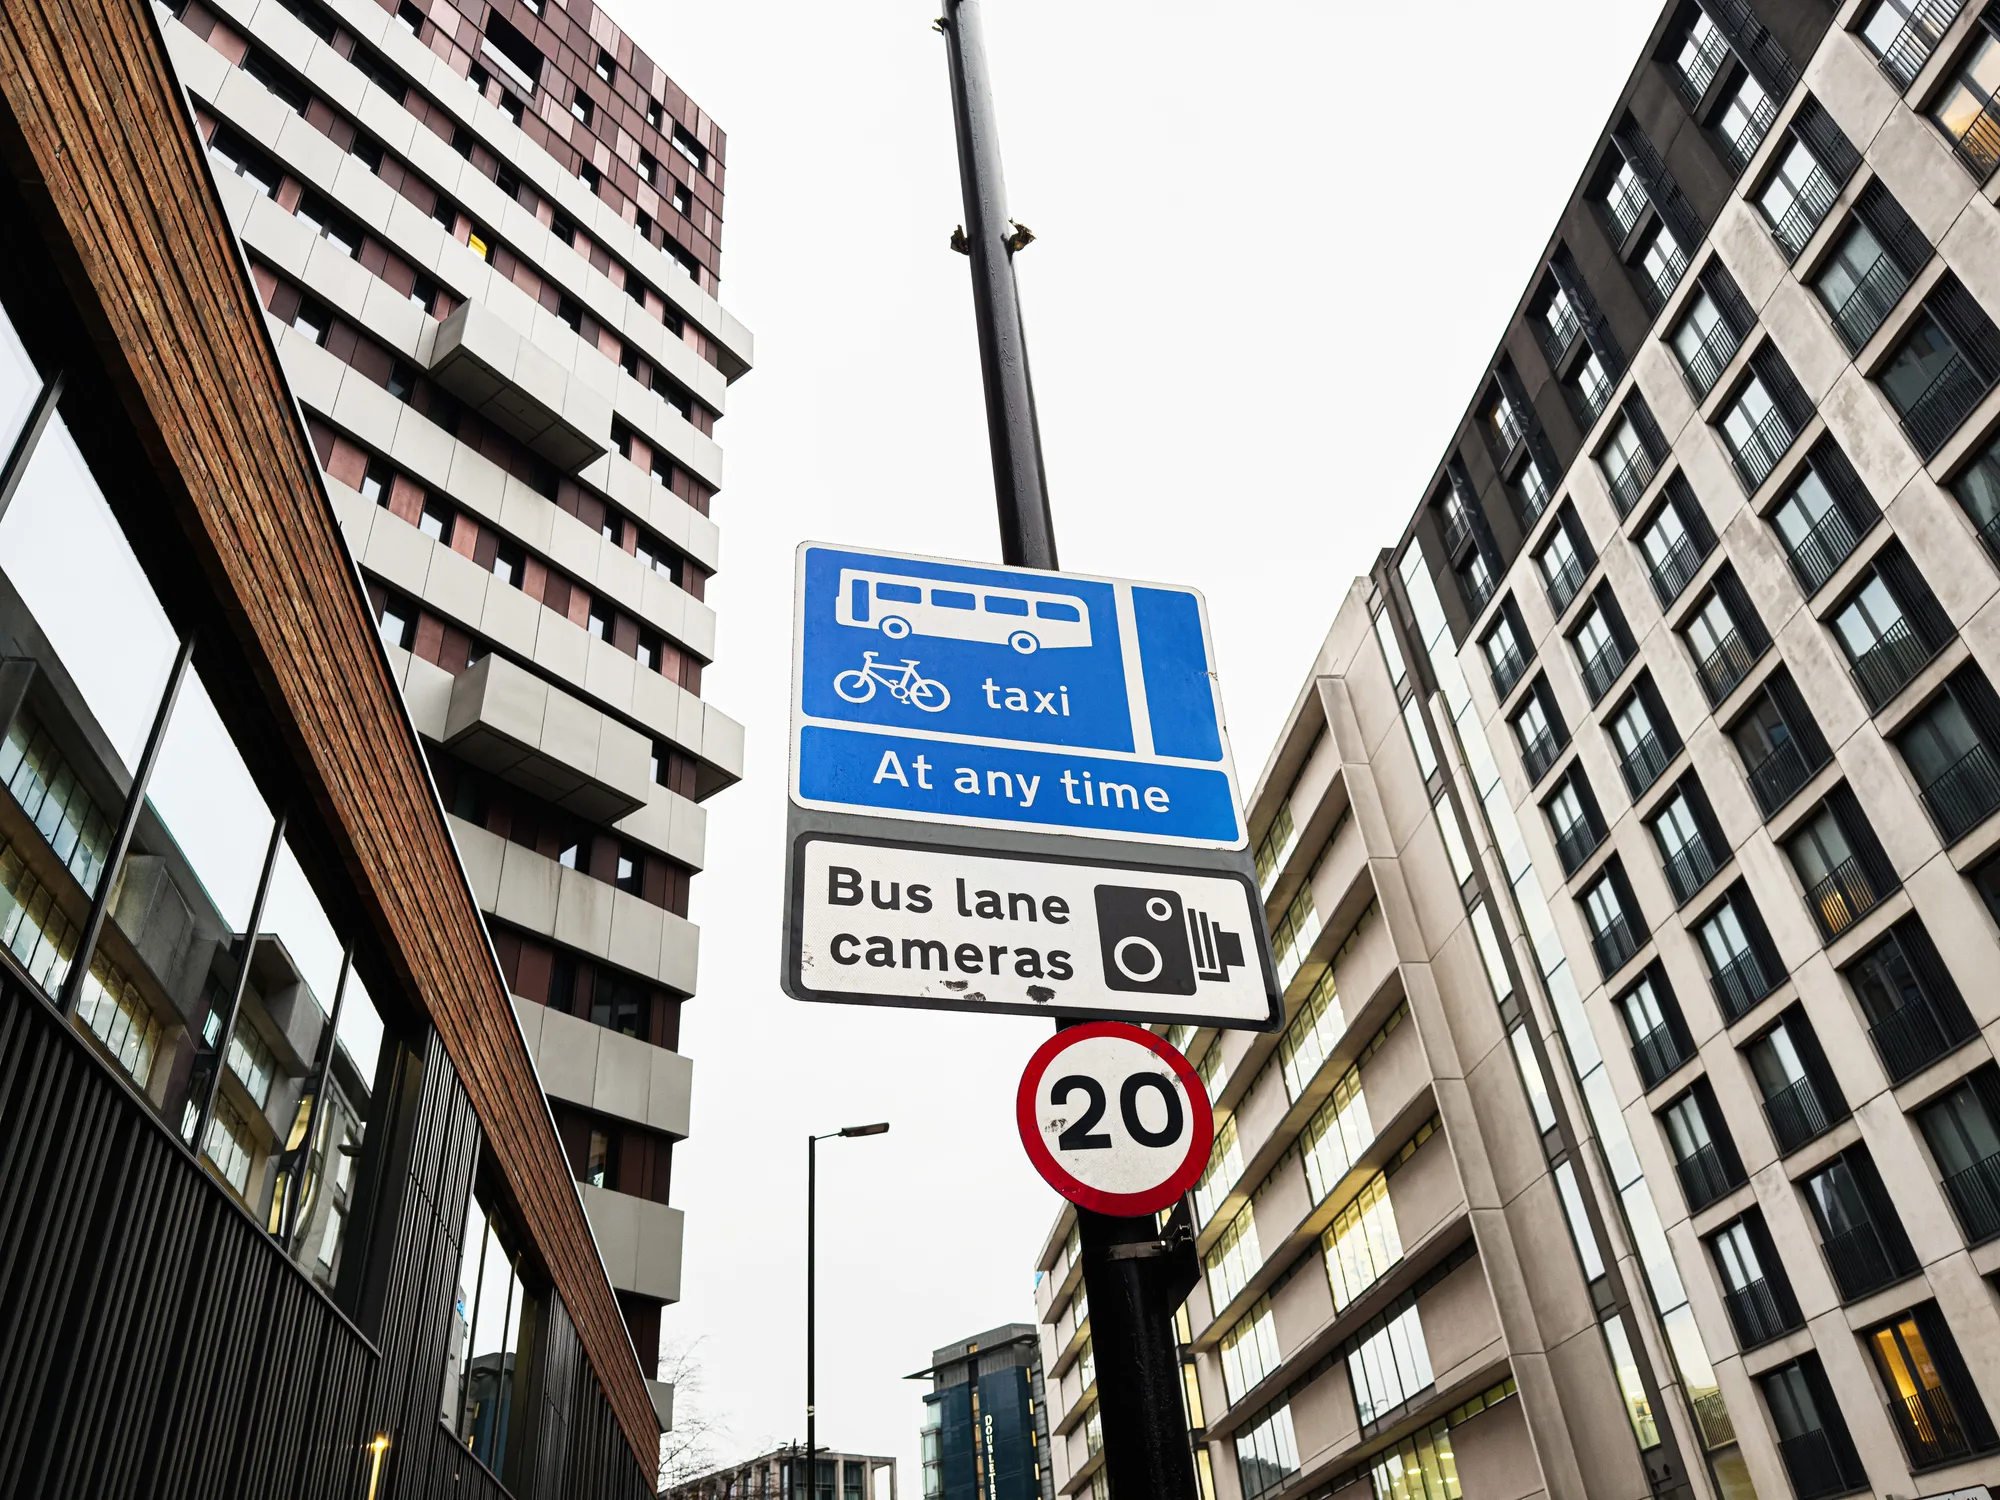
The moving-traffic ticket is the one that has changed the picture. In 2019-20 Haringey issued 29,948 of them; in 2024-25, 202,535, a rise of 576%. Southwark's went up 431%, Lewisham's 419%, Lambeth's 314%, Hammersmith and Fulham's 294% to 271,265, the largest number of any borough. The published statistics do not separate yellow boxes from school streets or low-traffic neighbourhoods, so the data cannot say which scheme produced which ticket. Other sources can, in part. The Department for Transport's 2024 review of low-traffic neighbourhoods found councils operating them 'issue an average of 36,459 penalty charge notices per scheme, with the highest number of penalty charge notices issued for a single LTN scheme exceeding 170,000'. TfL told a freedom of information requester that 122,190 tickets were issued for yellow box contraventions on its roads in 2025, at £160 each, reduced to £80 if paid within a fortnight; the most productive box was outside the fire station on West Hill in Wandsworth. A Confused.com request found that one bus-only street, Station Parade in Barking, produced £2,030,242 for Barking and Dagenham in 2024-25 from 33,440 tickets, and that the weight limit on Albert Bridge produced £1,971,714 for Kensington and Chelsea. A single double yellow box on Kingston Road in New Malden produced 6,568 tickets and £451,000 in the first eight months of 2025, about 27 a day; Kingston's whole parking surplus for the previous year was £6.1 million.122283032
The statutory guidance anticipates all of this and tells councils what to do about it: 'If local authorities detect hot spots where a disproportionate number of PCNs are issued or representations or appeals are being made, that should alert them to a possible need to review the cause.' At any location where contraventions 'could be avoided by reasonable improvements to the highway or to traffic signing, such improvements should be made, and appropriate monitoring carried out before enforcement action is considered'. The same document says 'poorly designed schemes can undermine enforcement overall and give rise to public perception of revenue raising'. The RAC had an engineer measure the hundred London and Cardiff boxes that produced the most tickets in 2019 and reported that 98 were larger than they needed to be, on average by half. The adjudicators' own register of key cases is indexed under headings such as 'adequacy of signs and lines', 'box extending beyond junction' and 'oversigning', and their 2022-23 report credited 'the improvement of signage after successful appeals' for a fall in moving-traffic appeals that year.112938
Who gives up
A ticket can be challenged twice: first to the council, then, if the council rejects the challenge, to an independent adjudicator. The council stage is invisible; no borough publishes how many challenges it receives or cancels, although the guidance says it should. The tribunal stage is published for every borough. In 2024-25 London's adjudicators received 47,935 appeals, one for every 197 tickets, and decided 42,907. Motorists won 19,454 of those, 45.3%, and in 10,962 of them, a quarter of all decisions, the borough did not contest the appeal at all. The Chief Adjudicator's report for the year notes 'an increase of just under 15% in the number of cases which the enforcement authorities choose not to contest an appeal', adds that 'no reasons are given in many instances', and asks authorities to tell appellants why. It also records that 'many appeals concern technical points regarding the compliance or otherwise with the enforcement process, especially with the contents of statutory notices. It goes without saying that authorities need to ensure compliance', that 'authorities need to make a bigger effort' to address Equality Act claims, and, after one authority failed to defend a judicial review, that all such claims should go to the council's solicitors. London Councils' own release puts the motorists' win rate at 49.4%, down from 54.9%, on a basis it does not state; the figures here are allowed appeals, including the uncontested ones, as a share of all decisions in the tribunal's published sheets. The Local Government Ombudsman, which cannot look at the merits of a ticket but can look at how a council handled it, said in its 2017 report on the subject that councils must not fetter their discretion to cancel and must not simply hand unpaid charges to bailiffs without following the statutory steps.3421033
Borough by borough the numbers describe very different practices. Hillingdon lost 83% of the 358 appeals decided against it, and 269 of its 298 defeats were cases it chose not to defend. Westminster lost 65%, 765 of 898 uncontested. Redbridge, whose motorists appeal more often than anyone's, one ticket in 95, lost 63%. Greenwich lost 58% and, unusually, contested almost all of them. At the other end Southwark lost 23% of 2,031 decisions, Sutton 24%, Hackney 25%, Ealing 30%, Wandsworth 31%. Three of the boroughs with the most tickets per resident, Kensington and Chelsea, Hammersmith and Fulham and Westminster, have the lowest appeal rates in London after Sutton, between one ticket in 330 and one in 580; whether that reflects clear signs, resigned visitors or a well-run council stage, the data cannot say. Outside London the tribunal is used far less: 11,156 parking appeals against 7 million tickets, one in 630, with 36% allowed, 2,064 of them not contested. Its moving-traffic caseload more than doubled in a year, from 852 to 1,963, and 29% of those appeals succeeded.37
Borough, 2024-25 | Appeals received | One appeal per | Decided | Won by motorist | Not contested by council |
|---|---|---|---|---|---|
Redbridge | 3,490 | 95 tickets | 3,061 | 62.9% | 1,166 |
Lambeth | 3,340 | 121 | 3,241 | 51.2% | 1,032 |
Newham | 3,226 | 136 | 2,768 | 47.9% | 503 |
Islington | 2,502 | 180 | 2,265 | 40.1% | 513 |
Southwark | 2,395 | 144 | 2,031 | 23.3% | 173 |
Haringey | 2,168 | 187 | 1,943 | 47.6% | 591 |
Westminster | 1,742 | 333 | 1,379 | 65.1% | 765 |
Hillingdon | 376 | 292 | 358 | 83.2% | 269 |
All boroughs and TfL | 47,935 | 197 | 42,907 | 45.3% | 10,962 |
The money
Every council keeps a parking account, and the law on what can be done with a surplus has barely changed since 1984: it goes first to making good past deficits and providing car parks, and then, where more car parks are 'unnecessary or undesirable', to public transport, highway improvement, London road maintenance and 'environmental improvement'. In London that pays for the Freedom Pass. The returns filed with MHCLG show what the account produced. In 2024-25 English councils took £2.16 billion from on- and off-street parking, spent £1.07 billion running it and kept a surplus the RAC Foundation put at £1.094 billion in November and the current version of the same data puts at £1.175 billion. London's boroughs made £634.9 million of it, up from £445.1 million in 2019-20; the rest of England £540.1 million. The provisional 2025-26 returns, filed this summer, show £1.39 billion, with London's share jumping to £837.6 million, a figure to treat with caution until it is audited. On the separate line for ticket income, which a fifth of councils leave blank, English councils reported £774 million from on-street parking tickets in 2024-25, about £711 million without one doubtful return, against £388.5 million in 2019-20; that excludes bus lane and camera tickets, which are reported elsewhere or not at all.135917
Westminster's parking account is the largest in the country: £129.4 million of income, £38.8 million of spending, a £90.6 million surplus, £48.8 million of it from parking tickets. Per resident that is £427, behind only the City of London's £678. Kensington and Chelsea's surplus of £49.7 million is £341 a head; Hammersmith and Fulham's £37.9 million is £199; Islington's £36.3 million £162; Camden's £32.3 million £149. Lambeth, with the second-highest ticket income in London at £41.0 million, has more than doubled its surplus since 2019-20 to £39.2 million. Haringey took £35.9 million in tickets, Ealing £31.8 million, Islington £31.4 million, Hammersmith and Fulham £30.4 million. The smallest surpluses are in the outer east and south: Sutton £1.6 million, £7.49 a head; Enfield £3.0 million; Greenwich £4.5 million. One borough's return is plainly wrong. Barking and Dagenham reported £75.7 million of ticket income on 246,298 tickets, £307 each, against £17.8 million the year before and £36.2 million the year after; it is left out of the per-resident rankings here and flagged in the appendix.59
Borough, 2024-25 | Parking income | Spending | Surplus | of which ticket income | Surplus per resident |
|---|---|---|---|---|---|
Westminster | £129.4m | £38.8m | £90.6m | £48.8m | £427 |
Kensington and Chelsea | £63.2m | £13.5m | £49.7m | £19.7m | £341 |
Lambeth | £63.3m | £24.1m | £39.2m | £41.0m | £125 |
Hammersmith and Fulham | £58.9m | £21.0m | £37.9m | £30.4m | £199 |
Islington | £61.2m | £24.9m | £36.3m | £31.4m | £162 |
Wandsworth | £42.9m | £10.6m | £32.3m | £8.6m | £95 |
Camden | £49.8m | £17.6m | £32.3m | £20.6m | £149 |
Haringey | £49.2m | £17.9m | £31.3m | £35.9m | £117 |
All London boroughs | £1,125.3m | £490.4m | £634.9m | £589.8m incl. one doubtful return | n/a |
Outside London the money is spread thinner and the leaders are seaside and cathedral towns rather than inner cities. Brighton and Hove's parking account made £33.2 million in 2024-25, £117 a resident, from £51.0 million of income, and its ticket income of £14.3 million, £50 a head, is the highest in England outside the capital. Nottingham made £20.0 million, £61 a head; Windsor and Maidenhead £7.7 million, £48; Bath and North East Somerset £9.2 million, £46; Canterbury £7.1 million, £44; Exeter £6.0 million; Lincoln £4.4 million; Guildford £6.5 million; Bournemouth, Christchurch and Poole £17.1 million; Torbay £5.8 million. Manchester's surplus of £19.5 million has more than doubled in five years and its ticket income, £14.8 million, has risen 153%. Portsmouth takes £43 a head in tickets alone. Forty-odd councils lose money on parking; Cambridgeshire County Council's account was £5.3 million in deficit.596
Outside London
Until 31 May 2022 only London boroughs could fine drivers by camera for moving-traffic offences; elsewhere a yellow box was a matter for the police, which in practice meant nobody. That day Part 6 of the Traffic Management Act was switched on for the rest of England, and councils that already ran parking enforcement could apply by letter from their chief executive. Twelve were designated in July 2022, 40 in July 2023, 21 in December 2024 and eight in December 2025: 81 in all, including Manchester, Birmingham, Leeds, Liverpool, Bristol, Sheffield, Newcastle, Nottingham, Leicester and many of the counties. The guidance requires six months of warning notices at each new camera before tickets start, and sets the ticket at the higher parking level, which outside London is £70, or £35 within 21 days. The councils reported 522,138 moving-traffic tickets to PATROL in 2024-25 and 856,643 in 2025-26, a rise of 64%; in the first four months of 2026-27 they were running 14% above the year before. Parking tickets outside London reached 7,022,126, up 9%, and bus lane tickets 1.92 million. The department's own analysis of responses to its 2024 call for evidence found a median of 59,254 moving-traffic tickets a year among the councils that answered, a median of thirteen yellow box cameras each where there had been two in 2019, and a median surplus from them of £1.4 million.1211151682114
The freedom of information trail fills in the names. The RAC found 36 yellow boxes enforced outside London and Cardiff in 2024, producing 32,748 tickets and £998,640; Manchester's six produced 13,130 tickets and £446,706, nearly half the total, and the single most productive box was at Dennis Roundabout in Guildford, 4,250 tickets and £81,445. Gloucestershire issued 30 yellow box tickets all year and Leeds 50. Bus lanes are older and bigger business: cinch's request to 38 large councils found 3,021,688 bus lane tickets and £103.8 million between January 2023 and December 2025, led by Manchester with 573,822, Bristol 344,366, Sheffield 275,360, Brighton and Hove 253,503 and Birmingham 218,906; one camera on Bridge Street in Manchester accounted for 157,974. Of 280,000 challenges to those councils, 31% succeeded. A crowdsourced compilation of 81 councils' disclosures puts the all-years bus lane total at 10.9 million tickets and £323 million gross.293139
The rules and the politics
The law and the guidance are not ambiguous about motive. The parking guidance, issued under section 87 of the 2004 Act, says: 'raising revenue should not be an objective of civil parking enforcement, nor should authorities set targets for revenue or the number of Penalty Charge Notices (PCNs) they issue', that 'the objective of civil parking enforcement should be for 100% compliance, with no penalty charges', and that councils 'should adopt the lowest charge level consistent with a high level of public acceptability and compliance'. Performance 'should never be based on the number of PCNs, immobilisations or removals'; contracts with bailiffs 'should not involve rewards or penalties that incentivise' their use. Councillors 'should not, under any circumstances, play a part in deciding the outcome of individual challenges'. And every authority 'should produce an annual report about their enforcement activities within 6 months of the end of each financial year' with a prescribed list of statistics, a requirement MHCLG restated in April 2026 while confirming it holds none of the data itself.1041
What a ticket costs is set in two different ways. In London the boroughs set the levels jointly, with the Mayor's approval and the Secretary of State's silence, and on 7 April 2025 they raised them for the first time since 2011: £160 for higher-level parking offences in inner London and the town centres and for bus lanes and moving traffic everywhere, reduced to £80 if paid within 14 days; £140 for higher-level parking elsewhere; and £110 or £90 for lower-level parking offences. London Councils said the old levels 'were not high enough to encourage compliance' and that ticket numbers had risen 70% since 2010 while the charge stood still; its chief operating officer said 'any net revenue raised from PCNs is reinvested in transport schemes, including paying for the Freedom Pass'. TfL had gone to £160 in 2022. Outside London the Secretary of State sets two bands in regulations, £60 and £40 or £70 and £50, with a 50% discount for prompt payment and a 50% uplift after a charge certificate, and those cash amounts date from 2008. The councils' associations gave the department research on 43 councils arguing the level no longer deters; the department told Parliament in October 2024 it had 'no current plans to raise the PCN levels', in March 2026 that 'officials are reviewing the research', in April that the findings 'will be carefully considered before any decisions are taken', and in September that it had no plan to publish its view of a one-month trial of higher charges it had allowed Bournemouth, Christchurch and Poole to run.17183714242327402526
The politics has run in a circle. In October 2023 the then Transport Secretary, Mark Harper, told the Commons that 'overzealous enforcement practices, from yellow box junctions to blanket 20 mph zones, are turning drivers into cash cows for councils' and that 'this anti-motorist campaign has run out of road'. His department's call for evidence the following March asked whether councils' surpluses 'after the costs of enforcement have been repaid' should go to the Treasury instead, 'effectively how speeding fines operate already', and warned that reliance on enforcement income 'risks an incentive to take a disproportionate approach to technical or minor breaches by well-intentioned drivers'. The analysis of the 4,787 responses was published by the next government two years later, in March 2026: 48 of the 53 councils that answered disagreed that restricting surpluses would make enforcement fairer, as did 61% of individuals, and the councils with surpluses blamed 'the current level of penalty charge notices not acting as a deterrent for drivers, with some motorists choosing to receive a PCN rather than paying for daily parking charges'. No policy followed. The present government's position is that London's levels 'should be for the Mayor of London', that the guidance 'makes clear that local authorities should never issue Penalty Charge Notices to raise revenue', and that a further power, to ticket pavement parking, will be given to councils 'before the end of this year'. In the Commons the complaint now comes from both benches: 'Parking charges have become a cash cow,' a Labour member for Dudley told a Westminster Hall debate in January 2025. The other live grievance is how to pay at all: in May 2025 the government handed the National Parking Platform, meant to let any parking app work in any council car park, to a consortium led by the British Parking Association, and the Liberal Democrats asked the same month for 'a requirement that all parking areas retain alternative, accessible methods of payment' for drivers without a smartphone.1920213736353442
What this can and cannot tell you
It can tell you, for every London borough and for TfL, how many tickets were issued each year since 2018-19 and of what kind, how many were appealed, how many appeals the borough lost and how many it did not bother to fight, and for every English council what its parking account earned, spent and kept, with the ticket line where it was filled in. It can tell you, for England outside London, the totals and the trend. It cannot tell you how many tickets an individual council outside London issues, because the tribunal publishes that only in a dashboard that cannot be downloaded, nor how many tickets any council cancels at the first challenge, because nobody publishes that at all. It cannot separate a school street ticket from a yellow box ticket, because London's statistics do not. Per-resident figures for the City and Westminster are driven by people who do not live there. The 2025-26 money is provisional, and one borough's return is wrong on its face. The appeal win rate counts an uncontested appeal as a win, which the tribunal does too; London Councils counts differently and gets a higher number. Everything else is the councils' and the tribunals' own figures, and the full tables, the method and the inconsistencies are in the attached appendix.1357

Comments
Sign in to join the conversation.