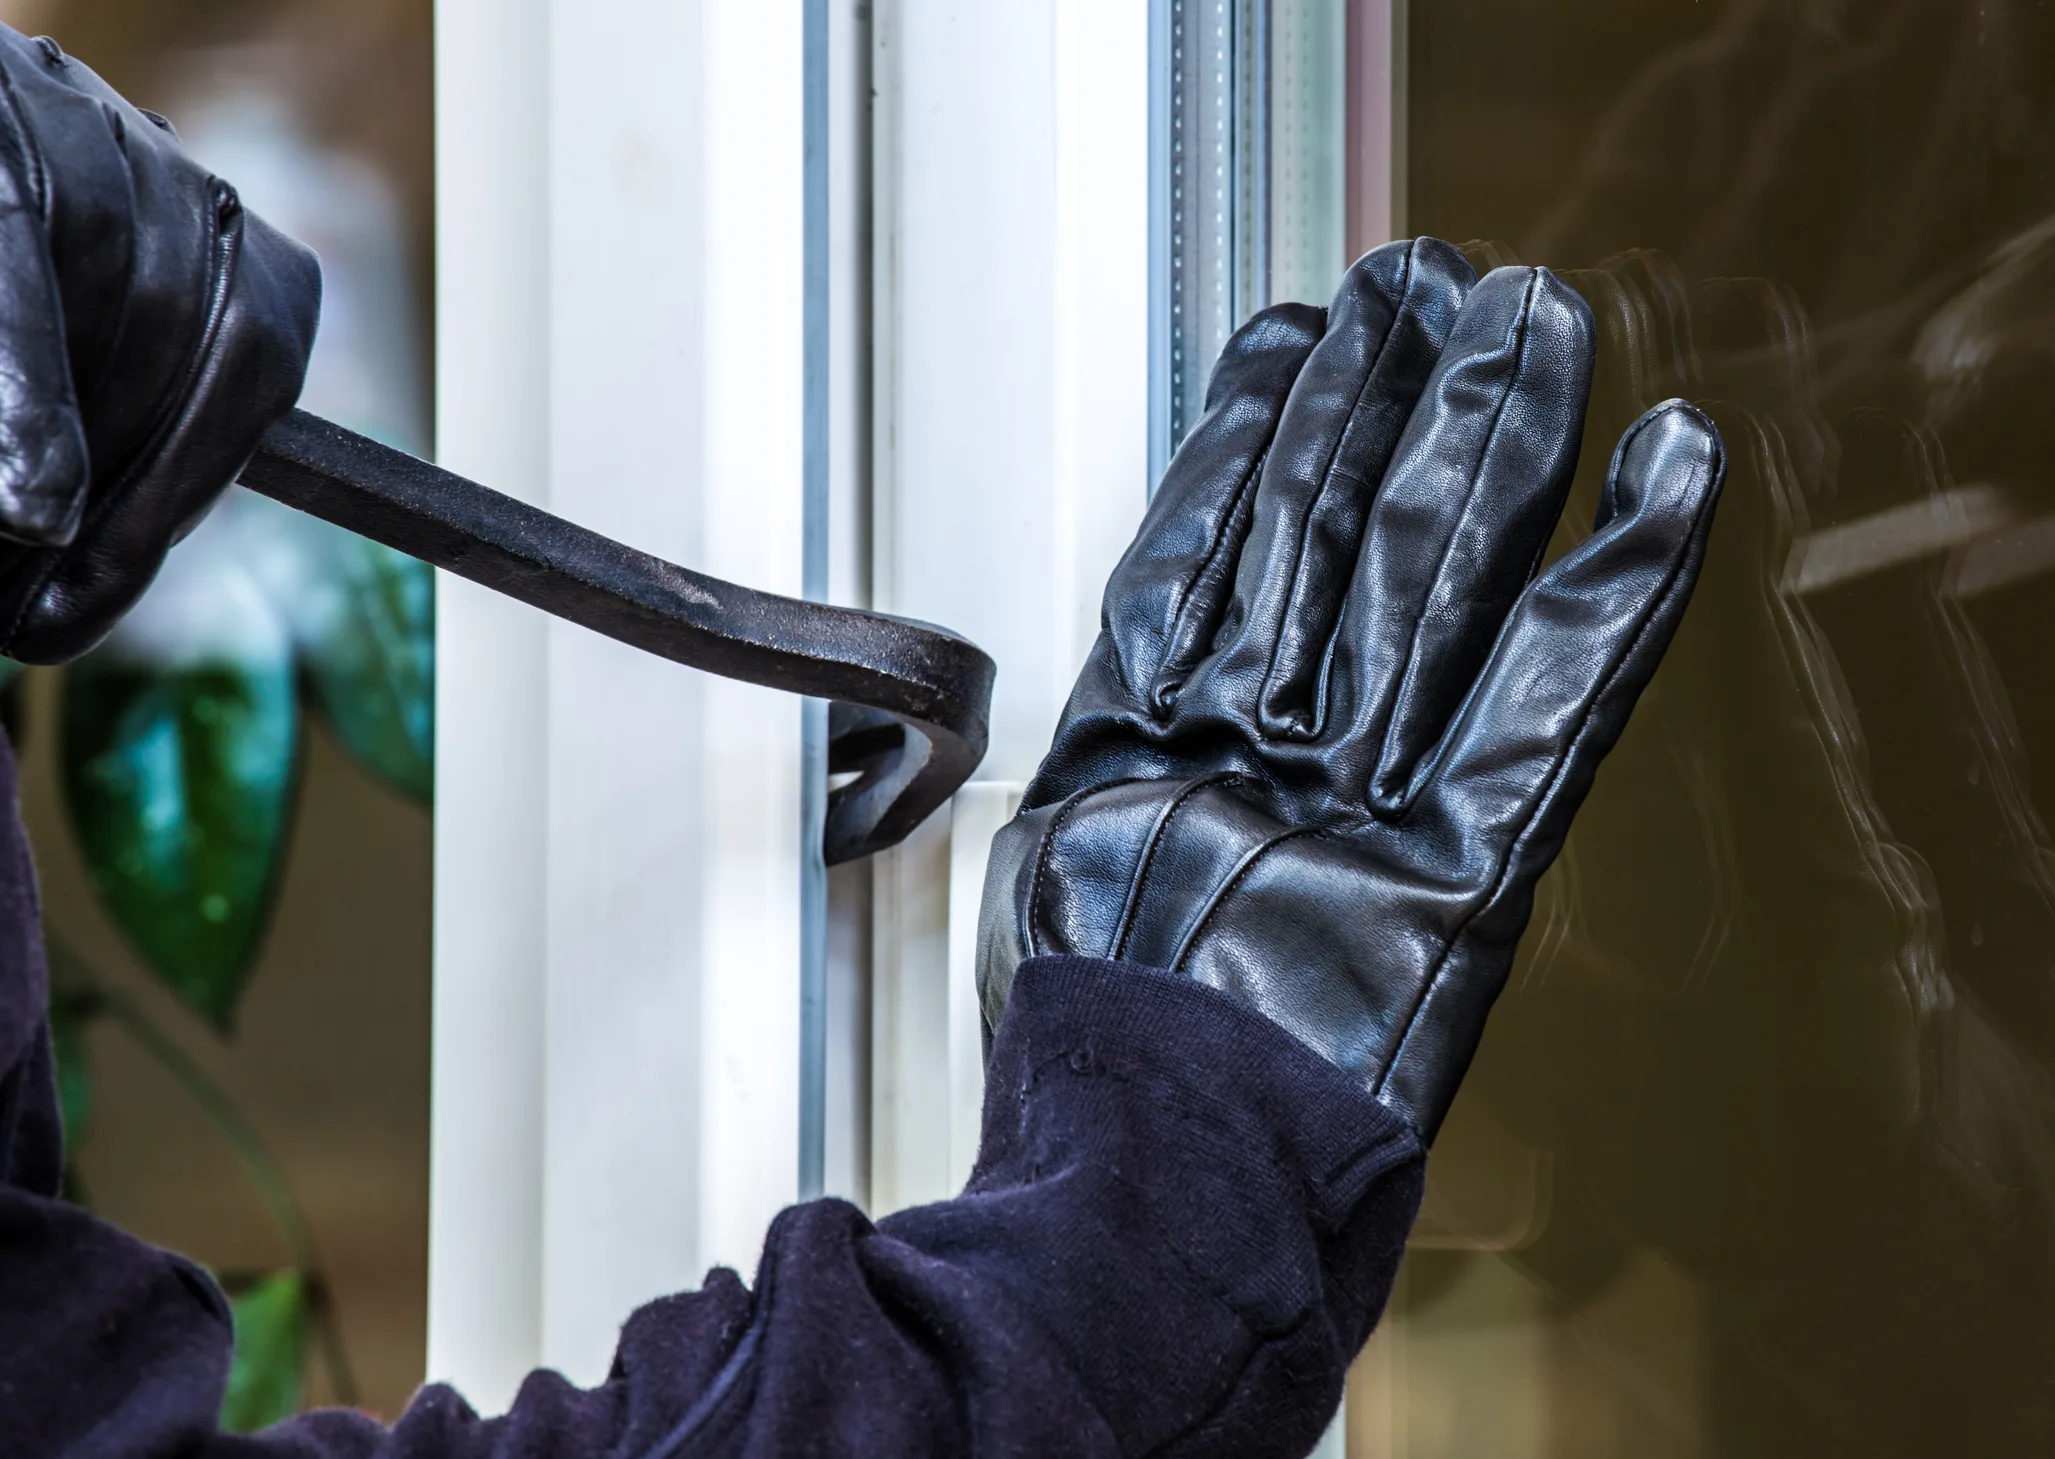
A burglary is one of the few crimes the state can count almost completely: most victims report it, because the insurer requires a crime number, and the police record it, because the rules say a break-in is a break-in. What happens next is also counted, in a Home Office file that gives every recorded offence an outcome code, and in a public archive that gives every individual burglary a location and a result. We downloaded both at the start of October, with the courts' data on what happens after a charge, the Crime Survey's count of what is never reported, and the parliamentary record of what ministers have promised. This is what the state does after a burglary, nationally, force by force, and in every London borough.
Five in a hundred
The Home Office published its outcomes for the year to March 2026 on 23 July. Police recorded 153,966 residential burglaries, a category that since 2017 covers the home and any building inside its boundary. Someone was charged or summonsed in 7,738 of them, 5.0%. 525 ended in a caution or other out-of-court disposal. In 17,277, 11%, a suspect was identified but the case died on "evidential difficulties". In 6,483 no suspect was found and the victim did not want to proceed. And 111,400, 72.4%, were closed as "investigation complete, no suspect identified". The remaining 6% had no outcome yet when the file was cut, which matters: last year's rate was 4.7% when first published and is 5.8% now, so this year's 5.0% will rise by about a point as cases mature. The Home Office's own split, introduced in 2023, puts the charge rate for burglary of the home itself at 5.9% and for an unconnected outbuilding at 2.4%.1244
Ten years ago it was better, but not by much. In 2015/16, the first clean year of the current outcomes framework, 7.4% of residential burglaries ended in a charge and 80% in no suspect. The charge rate fell to 5.0% by 2017/18 and sat between 4.6% and 4.8% for the five years to 2022, before edging up to 5.6% and then 5.8%. What rose instead is the middle category: cases where police found a suspect but could not or did not charge, from 8% of burglaries in 2015/16 to 12% now. Comparisons with the "detection rates" of the 2000s do not work, and the Home Office said so when it switched systems in 2014: a detection counted cautions, penalty notices and offences taken into consideration, and the department wrote that "the concept of a detection rate is not appropriate" and that it did "not intend to publish a detection rate that is aligned with those shown in previous years".264
The force table
The national figure hides a four-fold spread. South Wales charged in 11.8% of its 1,830 residential burglaries, Cheshire 11.7%, Lancashire 10.8%, Northumbria 10.0%, Greater Manchester 9.3%, Cumbria 9.0%. At the other end: West Yorkshire 4.2%, South Yorkshire 3.5%, Gloucestershire 3.2%, Avon and Somerset 3.0%, Wiltshire 2.6%, and the Metropolitan Police 2.5%. The forces at the top are not small or rural by any pattern; Northumbria and Greater Manchester are big urban forces. Nor is it volume: the Met's 32,718 offences are three times West Midlands' 10,337, and West Midlands charged in 6.0%. Three forces carry data flags the Home Office itself attaches: Greater Manchester could not supply data for most of 2019/20, Devon and Cornwall changed IT systems in 2023, and Humberside supplies no record-level data.21
London
The Met's position is not new, and it is getting worse. In 2015/16 it charged in 4.9% of residential burglaries, already below the national 7.4%. The rate fell to 3.0% in 2019/20, recovered to about 3.7% through the pandemic years, was 3.8% in 2024/25 and is 2.5% in the latest year, with 5.6% of cases not yet assigned, so expect it to settle nearer 3.5%. In every year the gap to the rest of the country has been two to three points. The Met records 21% of England and Wales's residential burglaries and 11% of its charges. Its share of cases closed with no suspect, 80.9%, is the highest of any large force.2
To go below force level we used the police.uk archive, which lists every crime the Met records with an anonymised location and its latest outcome. It does not separate home from shop burglaries, and its "charged" category includes cases awaiting court, so its rates run higher than the Home Office's: on this measure the Met charged in 4.7% of 47,584 burglaries between April 2025 and March 2026, every month at least six months old when the file was published, and closed 79.1% with no suspect. Mapped to boroughs, the best were Tower Hamlets (6.5% of 2,288 burglaries), Greenwich (6.4%), Hammersmith and Fulham (6.3%) and Hackney (6.1%); then Lewisham, Havering, Bexley and Camden at about 5.8%. Westminster, with the most burglaries of any borough at 2,786, was at 5.1%. The worst were Southwark, 3.2% of 2,374, Ealing 3.3%, Barnet 3.4%, Hounslow 3.4%, Bromley and Haringey 3.5%. Barnet closed 84.6% of its burglaries with no suspect, the highest in London. The City of London, a square mile with its own force and 475 burglaries, charged in 26%.8910
Over the three years in the archive the borough order is stable. Islington (6.4%) and Camden (6.3%) lead the three-year charge rates; Southwark (3.8%), Hounslow (3.6%) and Harrow (3.8%) trail. The same files show the Met's charge rate falling across the archive, from 5.7% of burglaries recorded in the year to August 2024 to 5.4% the next year, with the latest year still open. For comparison, the other big cities on the same measure in the same window: Newcastle 10.9%, Liverpool 10.5%, Birmingham 7.4%, Leeds 7.1%, Bristol 6.6%, Sheffield 5.0%. Manchester cannot be shown: Greater Manchester Police has supplied no data to police.uk for any month since September 2023, a gap the site's own changelog attributes to the force's IT transition.89
Thirteen days
The Home Office's timeliness tables say how long the no-suspect decision takes. For residential burglary in 2025/26 the median time from recording to any outcome was 18 days; it was 3 days in 2017/18. The median time to a charge was 56 days. The median time to "investigation complete, no suspect identified" was 13 days, unchanged for three years, and 5 days for an outbuilding. Of residential burglary investigations closed in the year, 11% were closed the same day, 31% within five days, 62% within a month. The police.uk files, which record the month each outcome is logged, agree: across all forces in the archive, between 34% and 41% of burglaries recorded in a month are closed with no suspect before that month ends, and 52% of all such closures land in the recording month. For the Met the same-month share runs at about 40%.318
Residential burglary investigations closed in 2025/26 | Share |
|---|---|
Closed the same day | 11% |
Within 1 to 5 days | 20% |
Within 6 to 30 days | 31% |
Within 31 to 100 days | 24% |
After more than 100 days | 14% |
The rule that permits this is one sentence in the Home Office's outcomes guidance for frontline officers, updated in April 2026. Outcome 18 "should be applied to those cases where despite a full and extensive investigation the police are unsuccessful in identifying an offender, or where at an early stage it becomes apparent that there are no realistic investigative lines to follow". There is no minimum period and no required list of enquiries; the test is that the crime was "investigated as far as reasonably possible", and the decision "must be endorsed by a supervisory officer with the rationale fully documented in the crime record". The victim must be told. The Victims' Code gives a victim the right to reasons within five working days if the police "decide not to investigate"; an outcome 18 is, by definition, an investigation that is complete.538
Every burglary attended
The last big promise on burglary was about turning up. On 23 September 2022 the Home Secretary wrote to chief constables that "the public want to know that an officer will visit them after a crime such as burglary". On 5 October the National Police Chiefs' Council announced that chiefs had "committed to attend all home burglaries", prioritising homes "as opposed to outbuildings and garden sheds"; its chair wrote that some forces "have struggled to achieve attendance at all burglaries with limited resources". On 8 June 2023 the NPCC confirmed that "all forces in England and Wales have been implementing this policy since March", and its burglary lead said: "We expect to be judged on the results the public see."14111213
The results the public can see are the ones above. What the public cannot see is whether the promise was kept. In February 2023 a minister told the Lords the government would "monitor and report on delivery against this". In October 2023, March 2024 and May 2024 the Home Office answered questions about attendance with the same sentence: it was "working with police leaders to ensure forces are making their attendance data available to the public". No national attendance figure has been published by the Home Office, the NPCC or the inspectorate. In November 2025, asked what assessment had been made of why the charge rate had fallen since 2015, the Home Office described the fall in recorded burglary and the Neighbourhood Policing Guarantee and did not give one. Three questions the same month asking for charge rates by force and year were answered with a link to the open data tables.2221262324
Ministers of both governments have claimed the pledge as theirs. In December 2022 the policing minister told the Commons that "thanks to the Home Secretary's intervention, police across the country are working to ensure that every single residential burglary receives an in-person visit", and that the Met's Operation Tenacity had produced "1,700 arrests in just six weeks". In January 2025 his successor said that "for too long a culture has been allowed to develop whereby victims of burglary and other crimes fear that even if they report what has happened, no one will come and nothing will be done", and, told that most burglaries in one county went unattended, said she was "concerned" and would write to the MP. The Residential Burglary Taskforce, which the Home Office cites as the body driving progress, was set up in April 2019 to "meet every 6 months". The only burglary charge figures a minister has put in writing in 2026 are for business premises: 7.2%, 8.2% and 8.8% for the years to September 2023, 2024 and 2025.16174225
The one measurable change the commitment produced was in the counting rules. The NPCC asked for a review because "a burglary of someone's family home is treated the same as the loss of a spade from a shed", and from April 2023 residential burglary was split into home and unconnected building. That is why the Home Office can now say the charge rate for a home burglary is 5.9%. Since then policy has moved on. The 28 August 2023 letter asking forces to pursue "all reasonable lines of enquiry" built on "the success of your commitment to attend all home burglaries" and asked them to use doorbell and dashcam footage and facial recognition. The current government's April 2025 announcement of 13,000 more neighbourhood officers opened with "90% of crime has been left unsolved", and January's police reform white paper promises "new targets on 999 response times, victim satisfaction, public trust and confidence". None of the targets is for burglary.13715192018
What the courts do
The one in twenty who are charged meet a system that is, by its own measures, severe. In the year to March 2026, 5,254 people were prosecuted for burglary of a dwelling, 4,061 were convicted and 4,123 sentenced; 2,860 of them, 69%, went straight to prison, for an average determinate term of 31.6 months, four times the average for theft offences generally. A quarter of those jailed got more than three years. The Crown Prosecution Service charged in 81.5% of the burglary cases police referred to it and won 85.4% of the 9,850 burglary prosecutions it completed. What has collapsed is the volume. In 2014, 14,731 people were prosecuted for dwelling burglary and 6,516 jailed; in 2025/26, 5,254 and 2,860. Prosecutions have fallen by nearly two thirds while recorded residential burglary, on a changed definition, fell by about a fifth.282930
Burglary of a dwelling, England and Wales courts | 2014 | Year to March 2026 |
|---|---|---|
Prosecuted | 14,731 | 5,254 |
Convicted | 10,318 | 4,061 |
Immediate custody | 6,516 (63.5%) | 2,860 (69.4%) |
Average custodial sentence | 26.2 months | 31.6 months |
Share of custodial sentences over 3 years | 18% | 24% |
Since 1999 a third conviction for domestic burglary has carried a minimum of three years, now section 314 of the Sentencing Act 2020, which since June 2022 a court may depart from only in "exceptional circumstances"; a guilty plea cannot take it below 80% of the minimum. How often it is used is not published. The Sentencing Council's last count, in 2017, found the number sentenced as third-strike burglars "gradually increased to a peak of around 1,000 in 2012, and then decreased to 760 in 2015", under a tenth of all domestic burglars sentenced. The regular Ministry of Justice statistics do not flag the cases; in 2026 the ministry produced bespoke tables for MPs on burglars with previous convictions who were not jailed, and said the data "is not regularly published or held in an easily accessible format". The ministry's current answer to repeat offending is a tag: a pilot of 24-hour GPS tags on released burglars, thieves and robbers, which it says cut reoffending by a fifth and matched 160 of 3,360 offenders to unsolved crimes.3132332741
Fewer victims, fewer reports, fewer detectives
Three things sit behind the charge rate. The first is that burglary itself has fallen: the Crime Survey estimates 348,000 domestic burglaries in the year to March 2026, against 784,000 in 2014/15, and the police count of all burglary is down from 410,866 to 223,456. The second is that fewer victims report it. The Crime Survey's reporting rate for domestic burglary fell from 63% in 2014/15 to 50% in the latest year, a statistically significant drop, and to 56% for burglary of the dwelling itself. The most common reason victims give for not reporting any crime is that the police "could not do anything". So the 5% is a share of a shrinking, self-selecting half.363534
The third is who is left to investigate. Officer numbers rose from 130,070 in March 2015 to 148,702 in March 2026, but the Home Office's functions table shows officers in investigation roles falling from 28,782 to 23,675; the Met's from 7,172 to 5,913. The department warns that force restructuring makes the functions data indicative rather than exact, and most burglaries are investigated by response and neighbourhood officers in any case. But the direction is the same in every large force. Scotland and Northern Ireland publish higher-looking figures, a 29% "clear-up" rate for housebreaking and a 17% "sanction outcome" rate for burglary, and neither is a charge rate: Scotland's test is a sufficiency of evidence that "can exceed 100%" in a year and covers non-dwellings, Northern Ireland's includes cautions and community resolutions, and the Home Office told the Lords in 2024 that Scotland "have a different method of counting burglary offences".37394043
What this can and cannot tell you
It can tell you, for every force and every London borough, what share of reported burglaries end with a charge, what share are closed with nobody identified, and how fast. It can tell you that the promise to attend every burglary was made, declared kept, and never measured in public, and that the rule allowing early closure has no clock on it. It cannot tell you whether a given closure was right: a burglary with no witness, no footage and no forensic trace may have no realistic line of enquiry on day one, and the same files show that charged cases take 56 days, so patience is not free. It cannot separate a home from a shop in the London borough figures, which is why the Met's 2.5% and its 4.7% are both in this piece. It cannot see Greater Manchester below force level at all. And it cannot see the half of burglaries that are never reported, except as the Crime Survey's estimate of their number. The inspectorate's 2022 report on acquisitive crime, which prompted the attendance pledge, could not be retrieved for this piece and is not quoted. The full force and borough tables, the timing analysis, the court figures and 23 written answers are attached.3
Comments
Sign in to join the conversation.