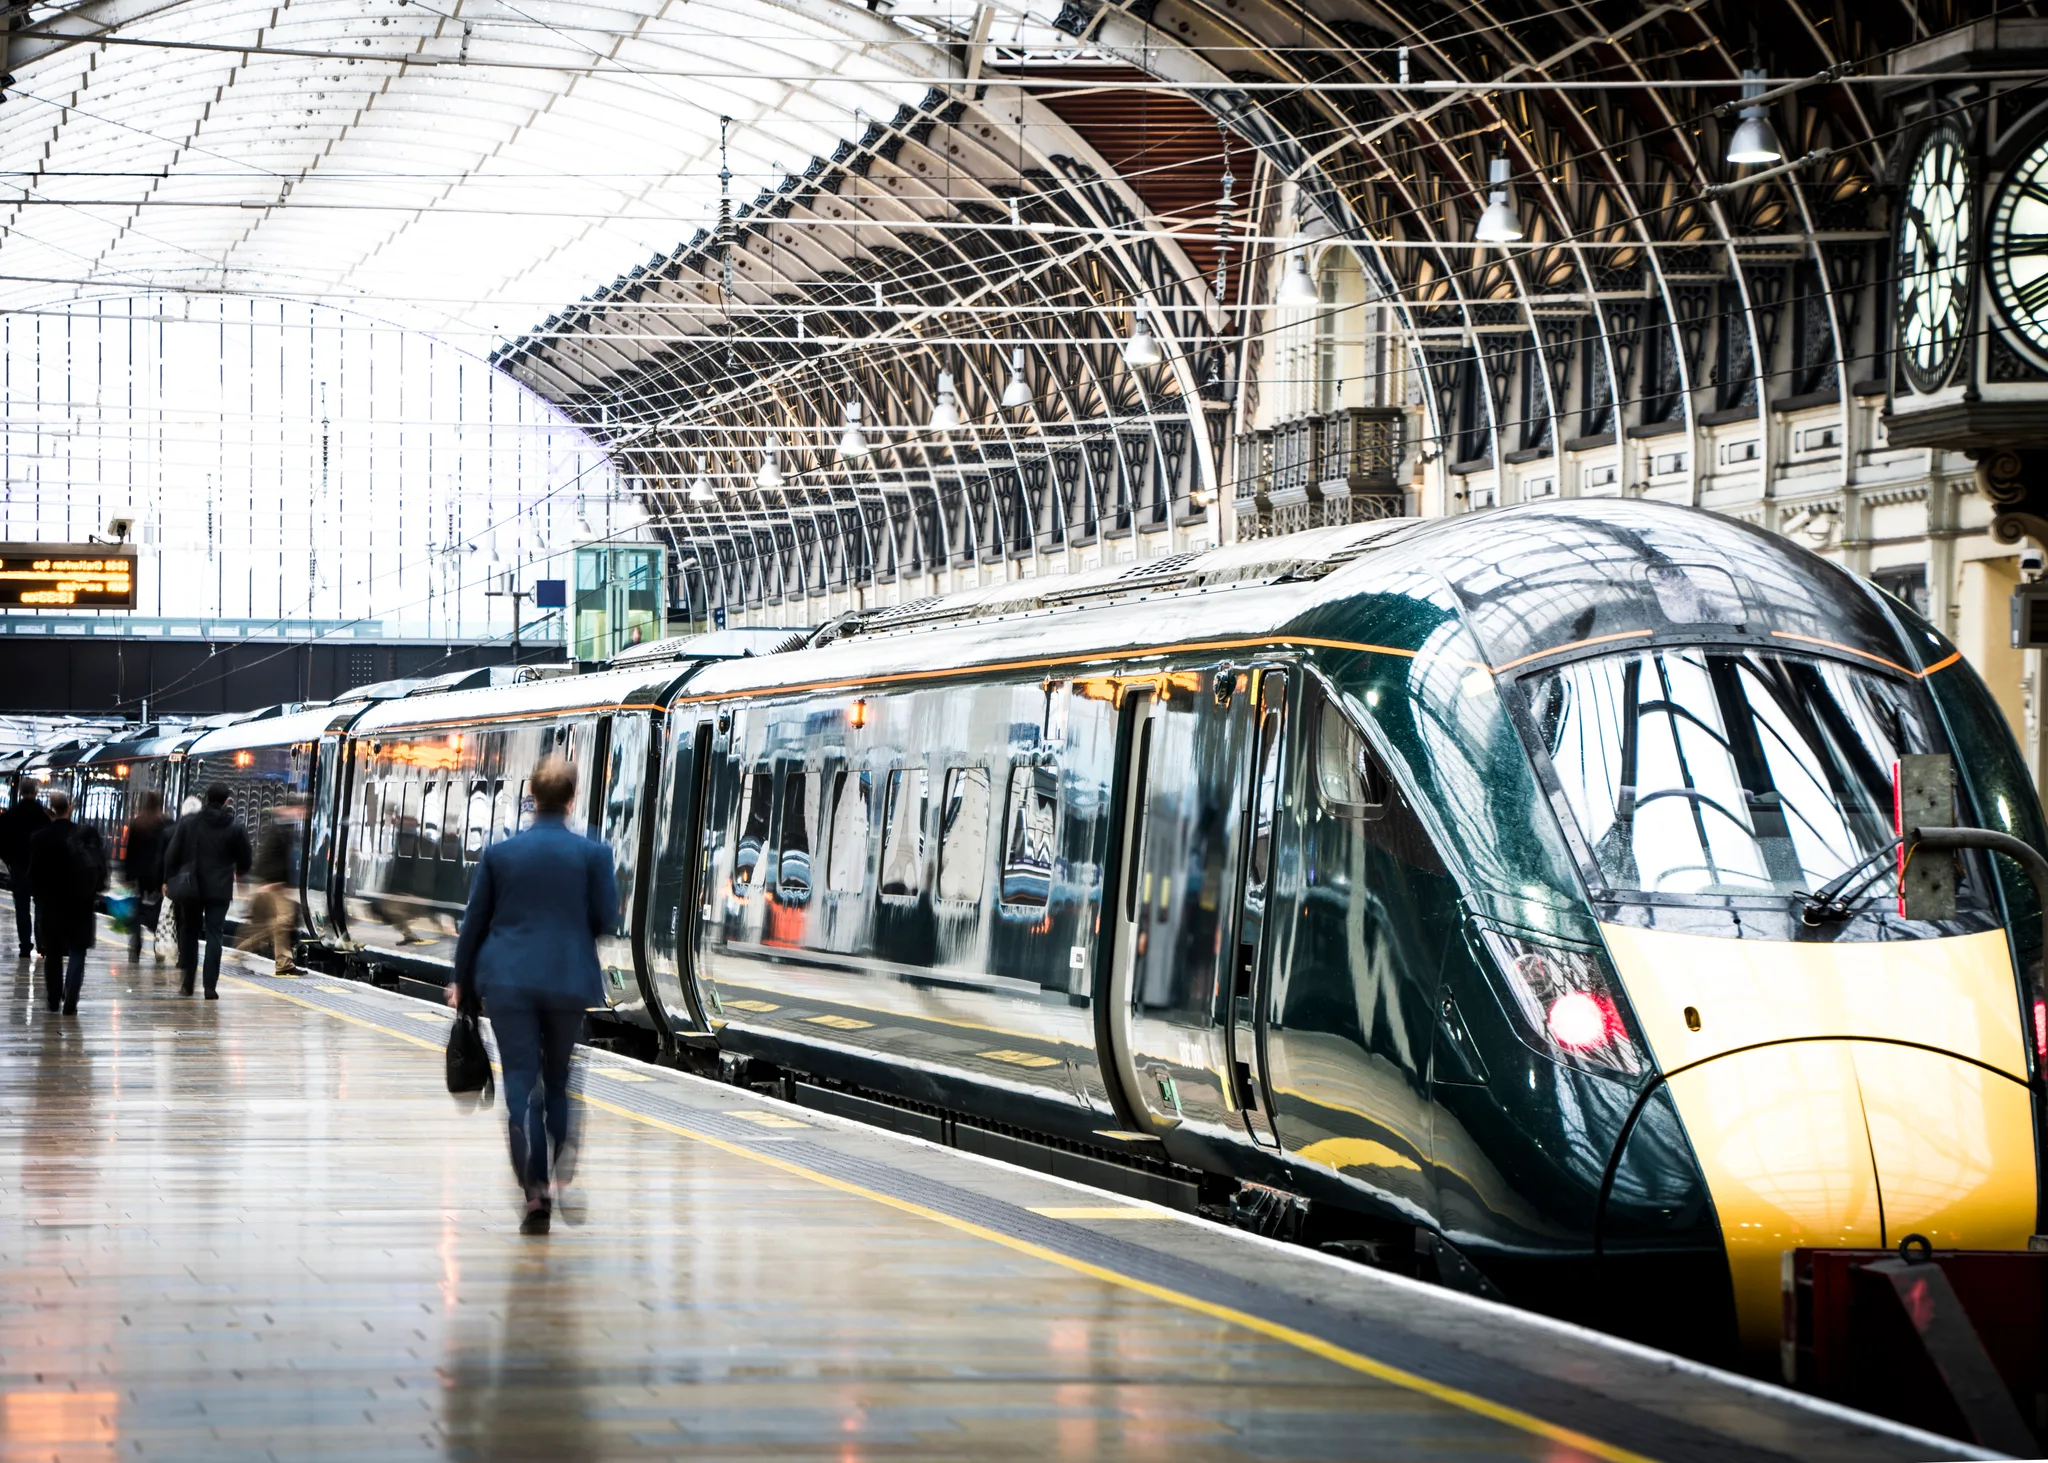
Every quarter the Office of Rail and Road publishes, for each train operator in Britain, how many trains it planned, how many it cancelled and what share of its station stops it reached on time. Every July it publishes how much fares rose. Every November it publishes what each operator took in fares and what the government paid it. Every year it counts the compensation claims and the complaints. Nobody puts these side by side by operator. This piece does: 24 operators, their punctuality and cancellations in 2019-20, the last year before the pandemic, against 2025-26 and the spring just gone; what their passengers paid per journey then and now, in cash and in real terms; the subsidy each received; the claims and complaints; and what passengers told Transport Focus. The method, every table and the caveats are in the attached appendix. One warning up front: the premise of this piece, that fares have raced ahead while trains got worse, is only half true. Trains are no better, but on the regulator's index the price of a ticket has risen more slowly than prices in general since 2020, and the money that would once have come from passengers now comes from the Treasury.18131620
One stop in three is late, and this spring was the worst for cancellations on record
The regulator's headline measure since 2019 is 'On Time': the share of recorded station stops a train reaches early or within 59 seconds of the timetable. In 2019-20 it was 65.0% across Britain. In 2025-26 it was 66.7%, and in April to June 2026, 68.1%. The older measure, trains arriving at their final destination within five or ten minutes, went the other way, from 86.2% to 85.5%. Cancellations, counting a part-cancelled train as half, rose from 3.4% of planned trains to 3.5%, or 3.6% once the trains quietly removed from the timetable the evening before are added in, which the regulator only began counting in 2023. In the spring quarter of 2026 the score was 4.1%, the highest April to June figure in the series. The railway is also running fewer trains: 7.79 million were planned in 2019-20 and 7.61 million in 2025-26, a cut of 2.4%, while journeys rose 5% to 1.83 billion. The 29 national strike days of 2022-23 and the 25 of 2023-24 do not show up as cancellations, because the trains were taken out of the plan in advance; the regulator estimates 450,000 and 188,000 trains respectively were never planned. Louise Haigh, then Transport Secretary, told the Commons in November 2024 that cancellations were 'at a 10-year high', up from 'around 2% of all services' in 2015 to 4% 'when the last Government left office'. Two years on, the full-year figure is 3.5% and the latest quarter 4.1%.123471835
Great Britain | On Time (stops within a minute) | Within 3 minutes | Cancellations | PPM (at destination) | Trains planned | Journeys |
|---|---|---|---|---|---|---|
2019-20 | 65.0% | 84.0% | 3.4% | 86.2% | 7.79m | 1,739m |
2022-23 | 67.8% | 85.4% | 3.7% | 86.4% | 6.63m | 1,385m |
2023-24 | 67.6% | 85.1% | 3.7% | 85.7% | 7.09m | 1,612m |
2024-25 | 67.0% | 84.8% | 4.1% | 85.2% | 7.39m | 1,729m |
2025-26 | 66.7% | 84.8% | 3.5% | 85.5% | 7.61m | 1,830m |
Apr to Jun 2026 | 68.1% | 85.0% | 4.1% | n/a | n/a | n/a |
Fares up 68% since 2010, behind inflation since 2020, and the taxpayer makes up the gap
The regulator's fares index, which weights every ticket type by what passengers actually spend, stood at 176.5 in January 2010 and 296.5 in March 2026, a rise of 68%. Regulated fares, the season tickets and off-peak returns whose increases ministers cap, rose 71%, the figure the Department for Transport itself gives in its Railways Bill factsheet; the department's other favourite number, that fares 'went up by 60%' under the Conservatives, is the same index measured from 2010 to 2024, and is also right. What the headline hides is the turn after the pandemic. Between January 2020 and March 2026 the index rose 23.6%, while the retail prices index the caps are tied to rose 40.7% and consumer prices rose 30.3%. Measured against RPI, the average ticket is 10% cheaper in real terms than in 2010; measured against CPI it is 5% dearer. The caps the government set were 2.6% in 2021, 3.8% in 2022, 5.9% in 2023 when inflation was 12%, 4.9% in 2024 and 4.6% in 2025, and the regulator measured regulated fares rising by 2.5%, 3.6%, 5.6%, 5.1% and 4.5%. Then, in November 2025, the Chancellor froze regulated fares in England for a year from March 2026, 'the first time in 30 years', the department says would otherwise have been a 5.8% rise and saves passengers £600 million in 2026/27; Scotland and Wales froze too, and the regulator measured regulated fares falling 0.1%. Unregulated first-class fares still rose 3.3%. The freeze runs to March 2027 and nothing has been announced beyond it.8932433329303147
Somebody pays for a railway whose prices lag inflation, and since 2020 it has been the taxpayer. At 2024-25 prices the franchised operators took £12.8 billion in fares in 2019-20 and £11.3 billion in 2024-25, 12% less in real terms, on almost exactly the same number of journeys. Their net subsidy went from £1.5 billion to £4.2 billion. In 2019-20 Avanti paid the government a £354 million premium, South Western £374 million, Greater Anglia £193 million and LNER £132 million; by 2024-25 South Western was receiving £128 million, LNER £93 million, Avanti's premium had fallen to £147 million and only Greater Anglia and Avanti still paid anything in. Northern's subsidy rose from £482 million to £719 million, £7.83 for every journey; ScotRail's to £777 million, £9.17 a journey; Transport for Wales's to £392 million, £12.52 a journey. The Rail Minister, Lord Hendy, put it to the Lords in September 2025 without euphemism: the railways 'are taking twice the subsidy that they did pre-Covid, and they do not run very well'. The National Audit Office said in March 2024 that the sector's performance 'for passengers and the taxpayer is not good enough and has not been for some time'.1312153446
Great Western: the one place you paid more and got less
There is no official fares index by operator, so the measure used here is what passengers actually paid per journey: each operator's fare income, as published by the regulator, divided by its journeys, in cash and after inflation. It moves with the ticket mix as well as the price list, which is why it is reported alongside the index above rather than instead of it. On that measure only four operators took more per journey in real terms in 2024-25 than in 2019-20: Northern, up 12.3%; the Elizabeth line, up 1.3%, though its 2019-20 figure is for the old TfL Rail service; South Western, up 0.8%; and Great Western, up 0.6%. Of those, only Great Western got worse on every performance measure. Its passengers paid 25% more per journey in cash, £13.02 against £10.40. The share of its stops on time fell from 66.8% to 60.9%, the third-largest fall of any operator; its cancellations rose from 2.5% to 4.0%; the delay minutes its trains suffered rose by a third, to 1.6 million, 63% of them attributed to Network Rail; its approved compensation claims went from 2.9 per thousand journeys to 12.7; and its subsidy rose from £391 million to £428 million. It remains in FirstGroup's hands until 13 December 2026, when it is scheduled to be the next operator taken into public ownership. Punctuality also fell at Heathrow Express, by 9.4 points, at c2c, by 6.2, at Merseyrail, Grand Central, Govia Thameslink, London Overground, Southeastern, Avanti and East Midlands. Cancellations rose most at CrossCountry, from 3.6% to 7.8%, Avanti, from 2.9% to 5.6%, and East Midlands, from 1.7% to 3.7%. The biggest improvers were West Midlands Trains, up 13.7 points on time, Greater Anglia, up 10.5, LNER, up 10.1, Chiltern, up 9.8, Transport for Wales, up 9.2, and TransPennine Express, up 7.0. Open-access operators and Heathrow Express set their own fares and receive no subsidy, so their revenue figures are reported but not ranked.13141011192351624
Operator | On Time 2019-20 | On Time 2025-26 | Cancelled 2019-20 | Cancelled 2025-26 | Paid per journey 2019-20 | Paid per journey 2024-25 | Real change | Status |
|---|---|---|---|---|---|---|---|---|
Great Western Railway | 66.8% | 60.9% | 2.5% | 4.0% | £10.40 | £13.02 | +0.6% | private until 13 Dec 2026 |
Northern Trains | 55.2% | 58.2% | 4.1% | 3.5% | £3.11 | £4.35 | +12.3% | public since 2020 |
South Western Railway | 59.9% | 65.0% | 3.8% | 4.0% | £4.83 | £6.06 | +0.8% | public since May 2025 |
Southeastern | 69.1% | 67.3% | 2.4% | 2.1% | £4.70 | £5.84 | -0.3% | public since 2021 |
West Midlands Trains | 52.8% | 66.5% | 5.1% | 3.8% | £4.88 | £6.03 | -0.8% | public since Feb 2026 |
GTR (Thameslink etc) | 70.9% | 67.7% | 4.5% | 5.2% | £4.55 | £5.34 | -5.7% | public since May 2026 |
Greater Anglia | 69.9% | 80.4% | 3.2% | 1.7% | £7.58 | £8.88 | -5.9% | public since Oct 2025 |
TransPennine Express | 41.0% | 48.0% | 7.8% | 4.4% | £8.99 | £10.47 | -6.4% | public since 2023 |
Chiltern Railways | 67.2% | 77.0% | 1.4% | 1.7% | £8.12 | £9.17 | -9.3% | public since Sep 2026 |
c2c | 82.5% | 76.3% | 1.5% | 1.6% | £3.70 | £3.99 | -13.3% | public since Jul 2025 |
Avanti West Coast | 39.6% | 37.9% | 2.9% | 5.6% | £31.18 | £32.38 | -16.6% | private until 7 Mar 2027 |
CrossCountry | 47.0% | 47.1% | 3.6% | 7.8% | £13.62 | £13.99 | -17.5% | private |
East Midlands Railway | 58.0% | 56.3% | 1.7% | 3.7% | £14.64 | £13.87 | -23.9% | private |
LNER | 45.2% | 55.3% | 3.0% | 2.9% | £36.90 | £33.23 | -27.7% | public since 2018 |
Avanti: 38% on time, one train in 18 cancelled, 1.5 million claims paid
Avanti West Coast, which runs London to Birmingham, Manchester, Liverpool and Glasgow, reached 37.9% of its stops on time in 2025-26, the lowest figure of any operator and below its 39.6% of 2019-20; 5.6% of its planned trains were cancelled, one in 18, and in April to June 2026, 7.1%, one in 14. Its passengers made 1,744,468 compensation claims in the year and 1,474,136 were approved: 40.6 for every thousand journeys, or one in 25, nearly three times LNER's rate and more than three times Great Western's. The regulator attributes 62% of its cancellations to Network Rail, and the department says infrastructure on the West Coast Main Line accounts for 'a third of delays'. In October 2022 the operator was put on a six-month contract after 'a shortage of available drivers'; in September 2023 it was awarded a contract to 2026 with options to 2032 on the strength of cancellations falling 'as low as 1.1% in July 2023'. Lord Hendy told the Lords in January 2025 that the contract 'does not allow the withdrawal of the franchise for performance that many people in this House think is lamentable'; on 28 September 2026 the department announced it would take the operator into public ownership 'at the first opportunity', 7 March 2027, with £840 million for the line's infrastructure. The oddity is that Avanti's passengers do not seem to mind as much as its figures suggest: 86% told Transport Focus they were satisfied with their last journey and complaints per 100,000 journeys have fallen by more than half since 2019. CrossCountry, the other long-distance operator still in private hands, cancels more trains than anyone, 7.8%, two-thirds of them for reasons the regulator puts on the operator, reaches 47.1% of stops on time and has the lowest satisfaction score of any operator, 75%. TransPennine Express, taken over by the government in May 2023 after its drivers stopped working rest days, has cut cancellations from 7.8% in 2019-20 and 6.6% in 2022-23 to 4.4%; ministers' claim of a '75% reduction' measures from its worst months in early 2023. LNER has improved its punctuality by ten points and is still on time at only 55.3% of stops.23162728392017
Who is paying more: Northern passengers, up 40% a journey
The passengers paying most more per journey are not on the expensive long-distance routes but on the commuter and regional ones. Northern's fare income per journey went from £3.11 to £4.35, up 39.8% in cash and 12.3% after inflation, while it ran 5.7% fewer trains and carried 7.8% fewer passengers. South Western's rose 25.5% to £6.06, Great Western's 25.2%, Southeastern's 24.1% to £5.84, Transport for Wales's 23.7%, West Midlands' 23.5%. Part of that is price and part is the end of the season ticket: commuters who travel three days a week on pay-as-you-go or daily tickets pay more per journey than they did on an annual season, even when the price list is unchanged. The long-distance operators went the other way as leisure travel on cheaper advance tickets replaced business travel: LNER's take per journey fell 9.9% in cash and 27.7% in real terms, East Midlands' fell 5.2%, CrossCountry's and Avanti's rose only 2.8% and 3.8% in cash, which is a fall of about a sixth after inflation. Advance tickets now account for 23.6% of fare revenue. Passengers' own verdict on value for money follows the bill: 41% of Southern's passengers, 44% of Thameslink's and South Western's, 46% of Southeastern's and 47% of CrossCountry's told Transport Focus their last journey was good value, against 73% on the Elizabeth line, 71% on the Overground, 67% on LNER and 65% on Merseyrail. The department's own factsheet concedes that one passenger in four rates fares as poor value.131092032
Operator | Paid per journey 2019-20 | Paid per journey 2024-25 | Cash change | Real change | Subsidy per journey 2024-25 | Value for money, satisfied |
|---|---|---|---|---|---|---|
Northern Trains | £3.11 | £4.35 | +39.8% | +12.3% | £7.83 | 56% |
South Western Railway | £4.83 | £6.06 | +25.5% | +0.8% | £0.77 | 44% |
Great Western Railway | £10.40 | £13.02 | +25.2% | +0.6% | £4.81 | 54% |
Southeastern | £4.70 | £5.84 | +24.1% | -0.3% | £3.04 | 46% |
Transport for Wales | £4.52 | £5.59 | +23.7% | -0.7% | £12.52 | 50% |
West Midlands Trains | £4.88 | £6.03 | +23.5% | -0.8% | £5.08 | 55% |
GTR (Thameslink etc) | £4.55 | £5.34 | +17.4% | -5.7% | £0.79 | 44% (Thameslink) |
Greater Anglia | £7.58 | £8.88 | +17.1% | -5.9% | pays £1.54 premium | 50% |
ScotRail | £3.73 | £4.31 | +15.5% | -7.3% | £9.17 | 61% |
c2c | £3.70 | £3.99 | +7.9% | -13.3% | £1.72 | n/a |
Avanti West Coast | £31.18 | £32.38 | +3.8% | -16.6% | pays £4.21 premium | 63% |
CrossCountry | £13.62 | £13.99 | +2.8% | -17.5% | £1.11 | 47% |
East Midlands Railway | £14.64 | £13.87 | -5.2% | -23.9% | £2.89 | 58% |
LNER | £36.90 | £33.23 | -9.9% | -27.7% | £3.50 | 67% |
Public ownership: better on average, but South Western and c2c got worse after transfer
Nine operators are now run by the government's DfT Operator company: LNER since 2018, Northern since 2020, Southeastern since 2021, TransPennine since 2023, and under the 2024 Act South Western from 25 May 2025, c2c from 20 July 2025, Greater Anglia from 12 October 2025, West Midlands Trains from 1 February 2026, Govia Thameslink from 31 May 2026 and Chiltern from 20 September 2026, with Great Western to follow in December and Avanti in March 2027. Ministers say the public operators 'perform better on punctuality and cancellations on average than those yet to come under public ownership'. Weighting each operator by its trains, the nine publicly run English operators reached 65.2% of stops on time in 2025-26 and cancelled 3.1% of trains; the five then still private reached 58.3% and cancelled 4.2%. The claim is true and does not mean what it is meant to: the private five include Avanti, CrossCountry and East Midlands, the long-distance operators whose figures are always worst, and the best public performers, Greater Anglia and West Midlands Trains, made their gains before they were transferred. Where there is a before and after, it is not flattering. South Western's cancellations were 3.6% in 2024-25, its last year under FirstGroup and MTR, and 4.0% in 2025-26, its first under the state; the share of stops on time slipped from 65.7% to 65.0%, delay minutes rose 7%, and in April to June 2026 it cancelled 5.2% of trains, against 2.5% in the same quarter of 2019. The opposition's figure, repeated in both Houses, is that cancellations rose 50% after nationalisation; the regulator's full-year figures show 9%, and the minister's own written answer in August says the operator 'did not meet its punctuality or cancellations targets'. c2c, which the department calls a top performer, reached 76.3% of stops on time in its first year in public hands against 82.5% in 2019-20 and 79.6% the year before transfer, and 77.4% this spring. Govia Thameslink, the biggest operator in Britain with one journey in six, went public at the end of May; its first quarter shows 69.7% on time against 67.7% for the year before, and the department has promised 115 extra drivers. The Conservatives' reasoned amendment against the Railways Bill in December 2025 said there was 'nothing in the Bill that guarantees growth in our rail network or cheaper fares'; the Lib Dems, who had called for a fares freeze since 2018, noted the Transport Secretary 'could not promise lower fares under renationalisation'.2425362337382640
Operator | Transferred | On Time, year before | On Time 2025-26 | Apr to Jun 2026 | Cancelled, year before | Cancelled 2025-26 | Apr to Jun 2026 |
|---|---|---|---|---|---|---|---|
South Western Railway | 25 May 2025 | 65.7% | 65.0% | 67.9% | 3.6% | 4.0% | 5.2% |
c2c | 20 Jul 2025 | 79.6% | 76.3% | 77.4% | 1.7% | 1.6% | 2.9% |
Greater Anglia | 12 Oct 2025 | 84.8% | 80.4% | 81.9% | 1.8% | 1.7% | 2.3% |
West Midlands Trains | 1 Feb 2026 | 64.4% | 66.5% | 65.6% | 4.9% | 3.8% | 4.7% |
GTR (Thameslink etc) | 31 May 2026 | 68.2% | 67.7% | 69.7% | 5.5% | 5.2% | 5.3% |
Chiltern Railways | 20 Sep 2026 | 78.9% | 77.0% | 77.4% | 2.2% | 1.7% | 1.6% |
London: Southeastern's main lines and Thameslink have gone backwards, and the Elizabeth line peak is slipping
London's commuters have had the mixed experience the national figures hide. c2c, out of Fenchurch Street, was the most punctual operator in Britain in 2019-20 and has fallen furthest of any commuter railway. Southeastern's overall score is down less than two points, but the regulator's route-level table tells a different story: on its mainline and high-speed services the share of trains arriving right on time fell from 65.1% to 47.4%, while its metro routes held up, and it is planning 9.7% fewer trains and carrying 20% fewer passengers than in 2019. Govia Thameslink is running 17.6% fewer trains; Thameslink's cancellations rose from 5.5% to 7.7% of planned trains and Gatwick Express's to 7.4%, with the department attributing a third of Thameslink's to train crew, while Southern's metro services improved. The Elizabeth line is the success and the warning in one: 257 million journeys last year, four and a half times the old TfL Rail, 78.4% of stops on time and the highest satisfaction of any large operator, but its peak-hour right-time score has fallen from 84.6% to 67.1% as the central section filled. The Overground's North London line lost nearly ten points. On fares, London passengers have had the opposite of the national pattern since 2016: the Mayor froze Transport for London fares from 2017 to 2020, and TfL says Tube and rail fares in March 2026 are 6% lower than if they had risen in line with national rail since 2016, though pay-as-you-go Tube and TfL rail fares rose again this March under the government's funding deal while Travelcards are frozen to March 2027. The national freeze covers the Southeastern, Thameslink, South Western and c2c season tickets that TfL does not set.23645104420
Compensation: 45% claim, 9.1 million claims, and nobody will say how much is paid
Delay Repay entitles a passenger to a quarter of the fare back after 15 minutes' delay on most operators and all of it after an hour, but only if they claim. The department's own survey, published in February 2026, found 45% of passengers with an eligible delay claimed in 2025, down from 47% in 2023, 'the first time since the research began that the claim rate declined'; a quarter 'didn't even think about it' and a quarter 'didn't think I could claim'. Transport Focus has called for 'a fully automated compensation scheme'. Operators closed 9.1 million claims in 2025-26, 9.5% more than the year before, and approved 80.5% of them. Four operators account for most of the claiming: Avanti, 40.6 approved claims per thousand journeys, Lumo 26.7, LNER 13.8 and Great Western 12.7, up from 2.9 in 2019-20. On the TfL concessions, which run their own schemes, the figures are near zero. What the regulator does not publish, for any operator, is how much is paid out; its table counts claims, not pounds, and this piece could not fill the gap. Labour's 2024 rail plan complained that '300 people are employed full-time to argue over whose fault delays are' and that 'fewer than half of train operators have chosen to introduce automated, one-click delay repay'; two years on, the minister's answer is that ten of the department's 14 operators now do.2322164241
What this can and cannot tell you
It can tell you, for every operator, what the regulator recorded about punctuality, cancellations, trains planned, journeys, fare income, subsidy, compensation claims and complaints in 2019-20 and 2025-26, and what the national fares index did. It cannot tell you what any one ticket costs now against 2019, because no official fares index exists by operator; fare income per journey is what passengers paid on average, and it moves with the mix of season, advance and walk-up tickets and the length of journeys as much as with the price list, which is why the long-distance operators show falls. The finance tables stop at 2024-25, a year behind the performance figures. On Time counts every station stop within a minute and replaced the old destination-based measure in 2019; the two can move in different directions. The cancellations score excludes trains removed from the plan before 10pm the previous day, which the regulator has counted separately only since 2023, and the strike years cut the plan rather than raising the score. The route-level London figures use a different and lower 'right time' measure and are compared only with themselves. Transport Focus's 2025 survey is an online panel and its 2020 survey was conducted on trains, so satisfaction is reported for each but not compared across them; the 2020 figures are in the appendix. Operators are compared as the regulator defines them: Thameslink, Southern, Great Northern and Gatwick Express are one operator, and so are West Midlands Railway and London Northwestern. The public-versus-private comparison weights operators by trains planned and, as the text says, reflects which routes each group runs. All figures are for Great Britain unless stated; the 2026 fare freeze applies to regulated fares in England and was matched in Scotland and Wales.18132021
Comments
Sign in to join the conversation.